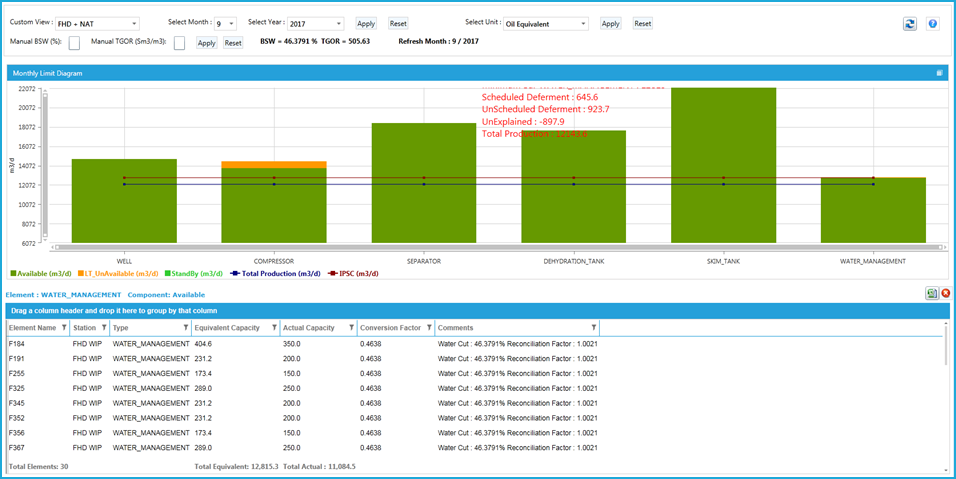
Visualizes the Integrated Production System Capacity against the actual production for overall production system optimization review.
The tool allows shows the limit diagrams:
In oil, water or gas capacity units
To simulate changing water cuts and GOR’s
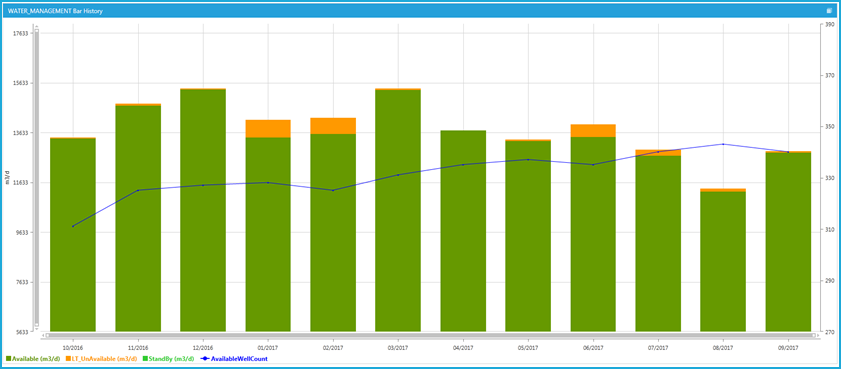
Shows historical trends of the constraints to monitor improvement towards the system capacity
Standardized view of the limit diagram
2 hrs per station (15) for main Limit Diagram for North, every month = 360 hours per year.*
½ hr per station for history view for North every month = 90 hours per year. *
South and Gas benefits are expected to be similar, so total of 1000-1500 hrs per year.
Alignment and understanding of the constraint leading to an efficient PSO review and identification of more opportunities.
Monthly Live Limit Diagram
Constraint history
Limit diagrams deployed
Man-Hours saved for North Assets per Yr
Man-Hours saved for South and gas Assets per Yr