
- Wells
- Reservoirs
- Facilities
- Asset Management
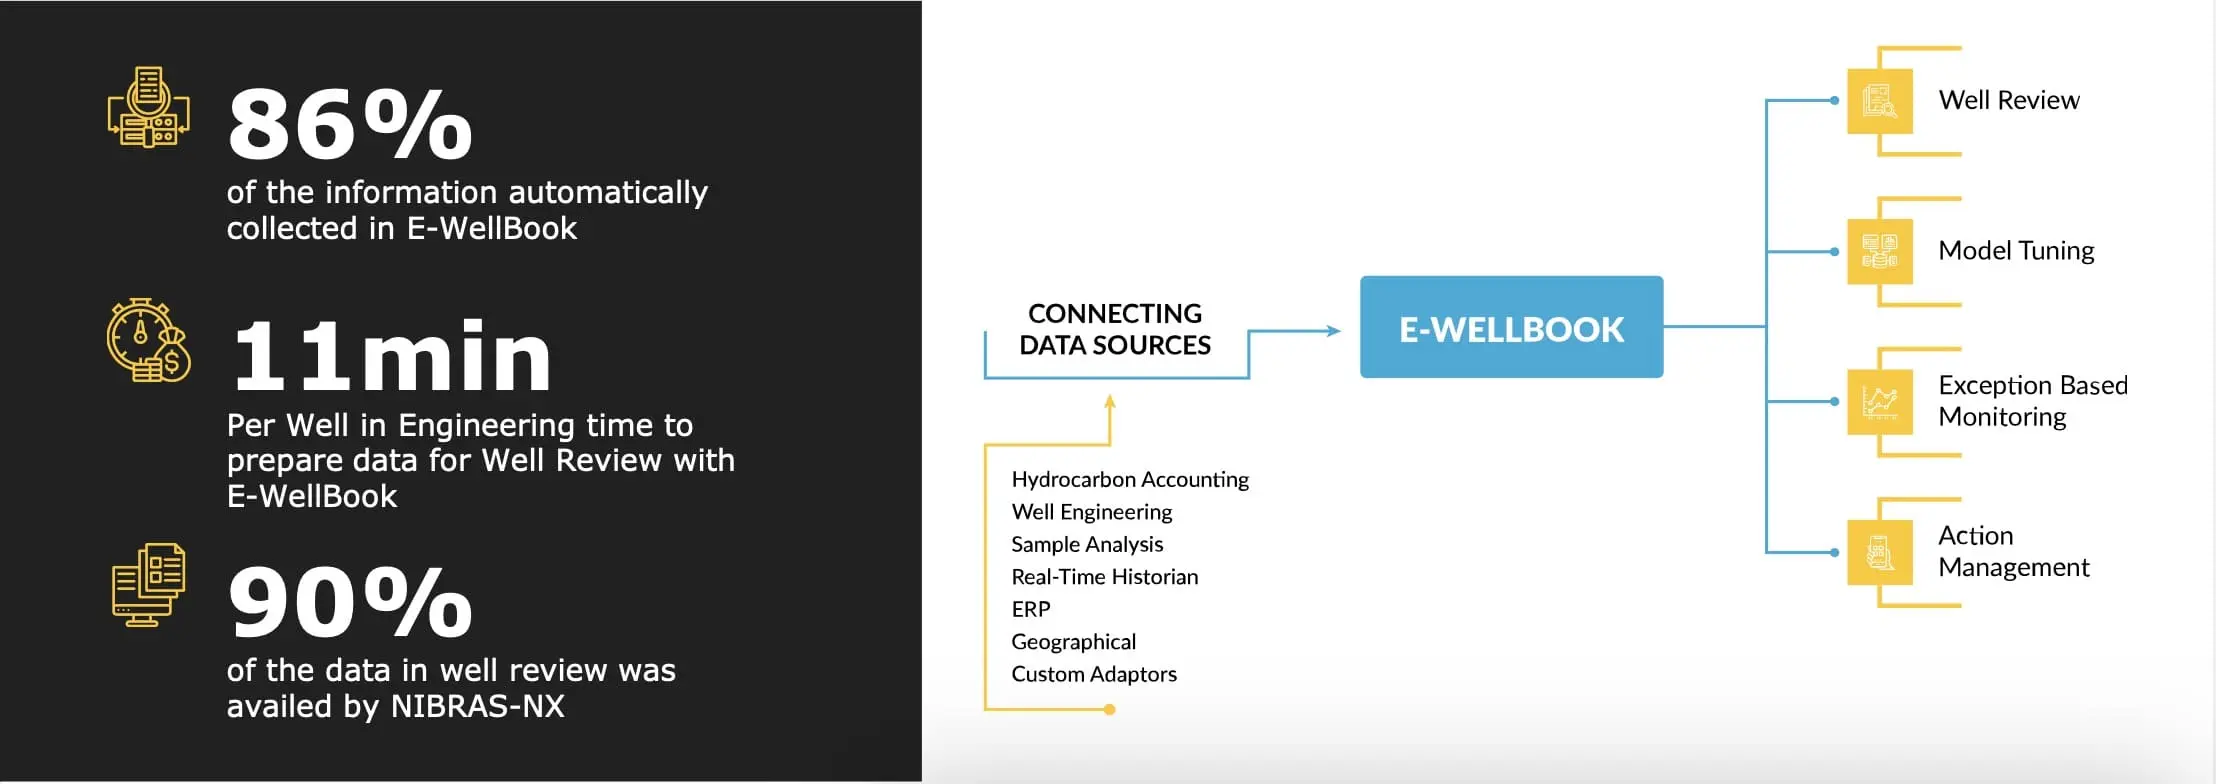
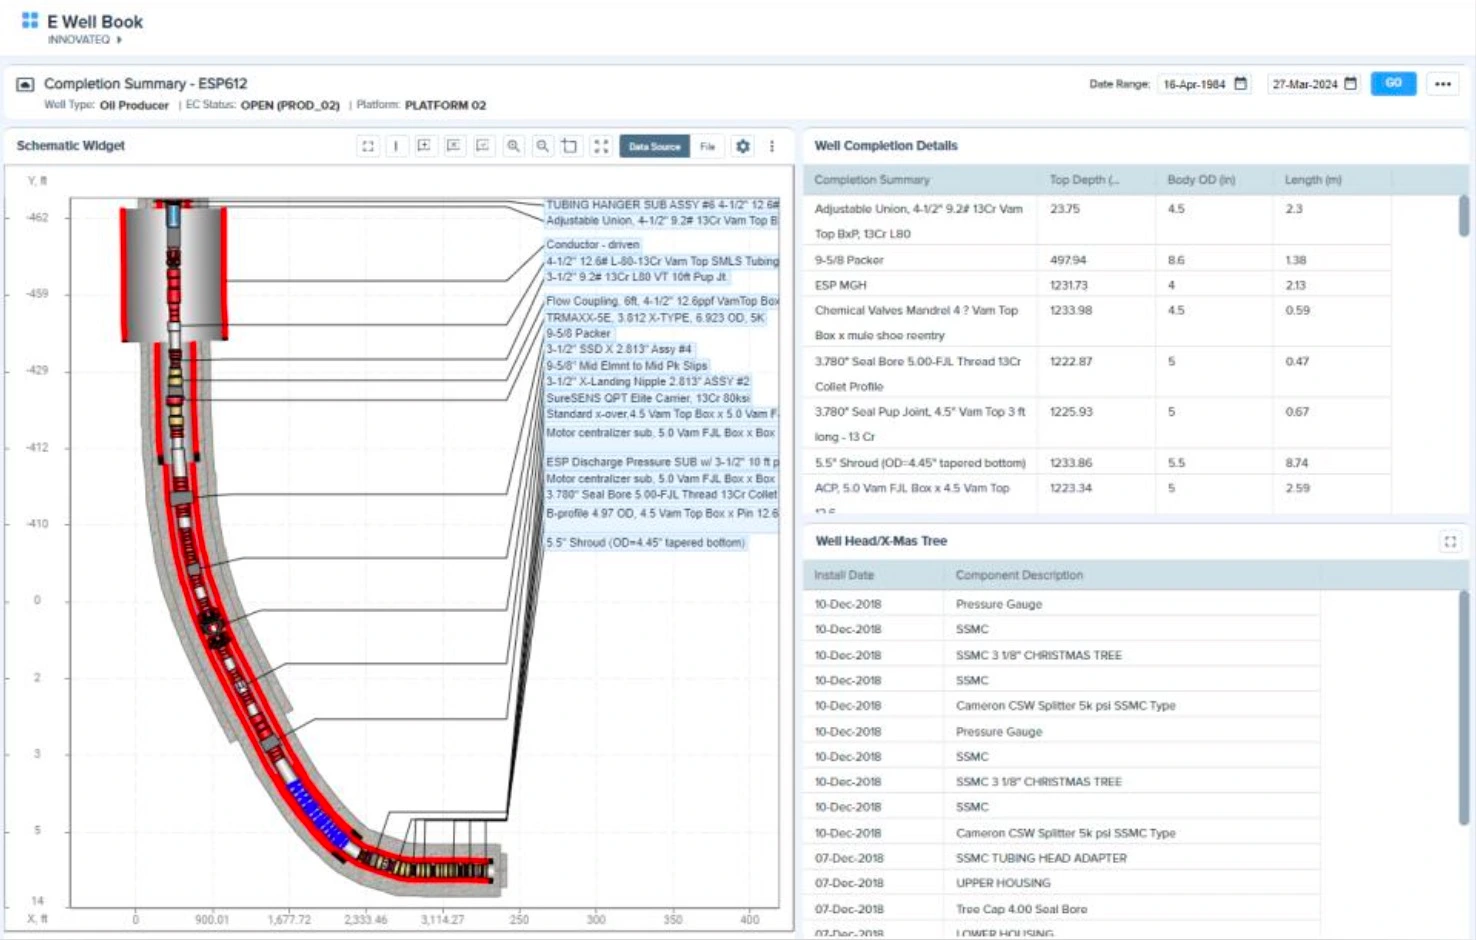
E-Well Book
Unparalleled Flexibility for Data Integration
NIBRAS-NX E-WellBook collects all your corporate data stored in different applications in one interactive visualization layer. The electronic well book is the Single Version of the Truth that allows your engineers to collaborate and focus on analyzing a problem rather than searching for the data. The tool assigns ownership to your structured and unstructured data as well as interacts with models to simulate different scenarios.
ADVANCED FEATURES
- Interactive visualization of deviation data, interaction log, etc.
- Historical analysis on advanced trending functionalities
- Real time data trends overlayed with events data
- Visual well operating envelopes
- Observation logging
- Action management through human workflows
- Defined data ownership
- Physical model integration with scenario simulations (Petex’s Prosper, Weatherford’s Lowis, extendable with custom adaptors)
- Data driven model integration (Production Universe)
- PDF data reporting for each well review for future reference
- Customisable visualisation by super users
- Cloud or On-Premise hosting
SUPPORTED DATA TYPES
- Real-time Data Historian
- Relational data (Oracle or SQL)
- Unstructured data
- Restful API’s
- GIS
- SharePoint
- Excel Files
Note: Architecture is open to create custom adaptors to connect to your proprietary applications
iNNOVATEQ COMMITS TO A SUCCESSFULL DEPLOYMENT OF YOUR DX ROADMAP
STANDARD WELL DATA VISUALIZATION
- Basic Well Status Information
- Well Test and Production History
- Completion and Artificial Lift Data
- Deviation Survey Data
- Geological Maps and Formation Data
- Well Logs
- Reservoir Fluid Data
- Production Chemistry
- Well Integrity Data
- Well Intervention and Maintenance Records
- Historical Drilling Records
- Real-time Data
- Hydrocarbon Accounting Data
- Sample Management Data
- ERP
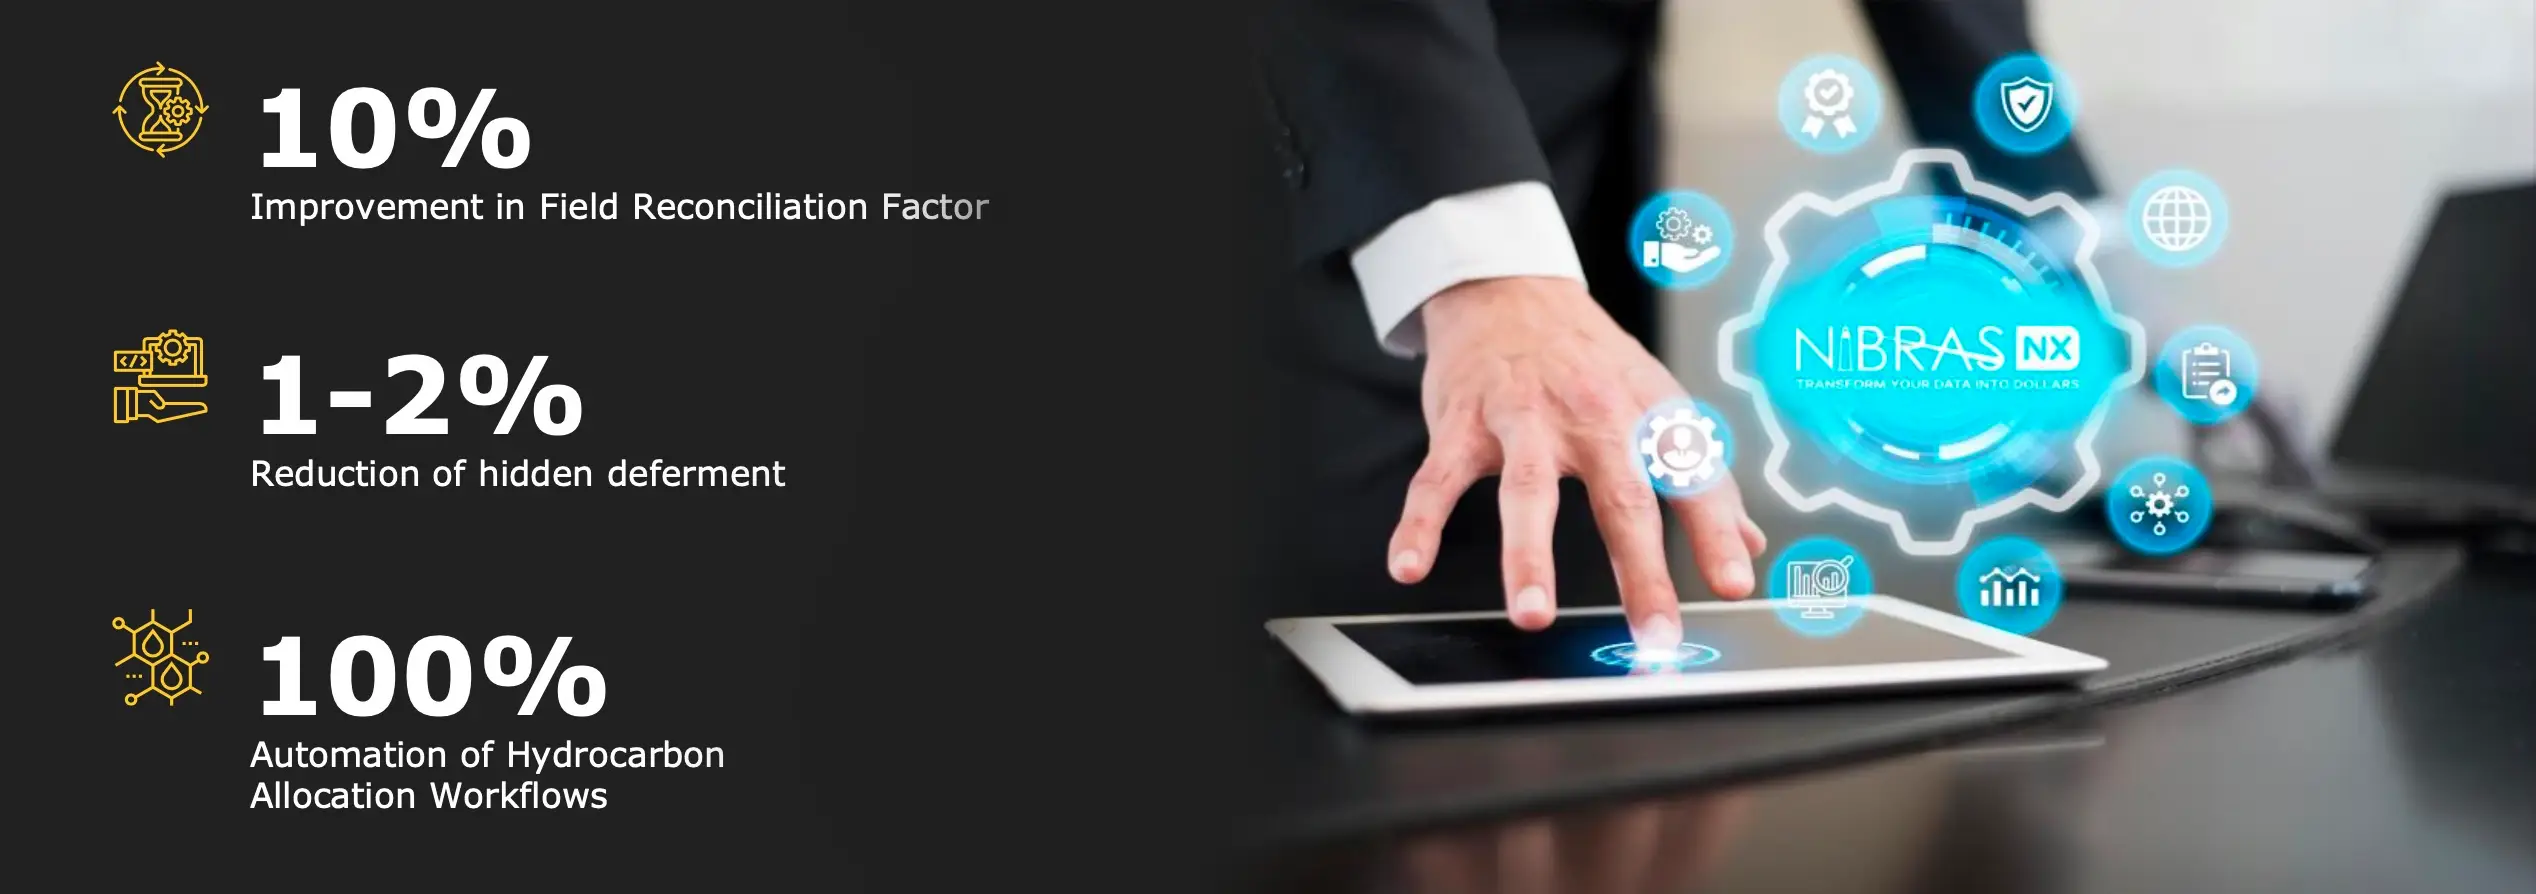
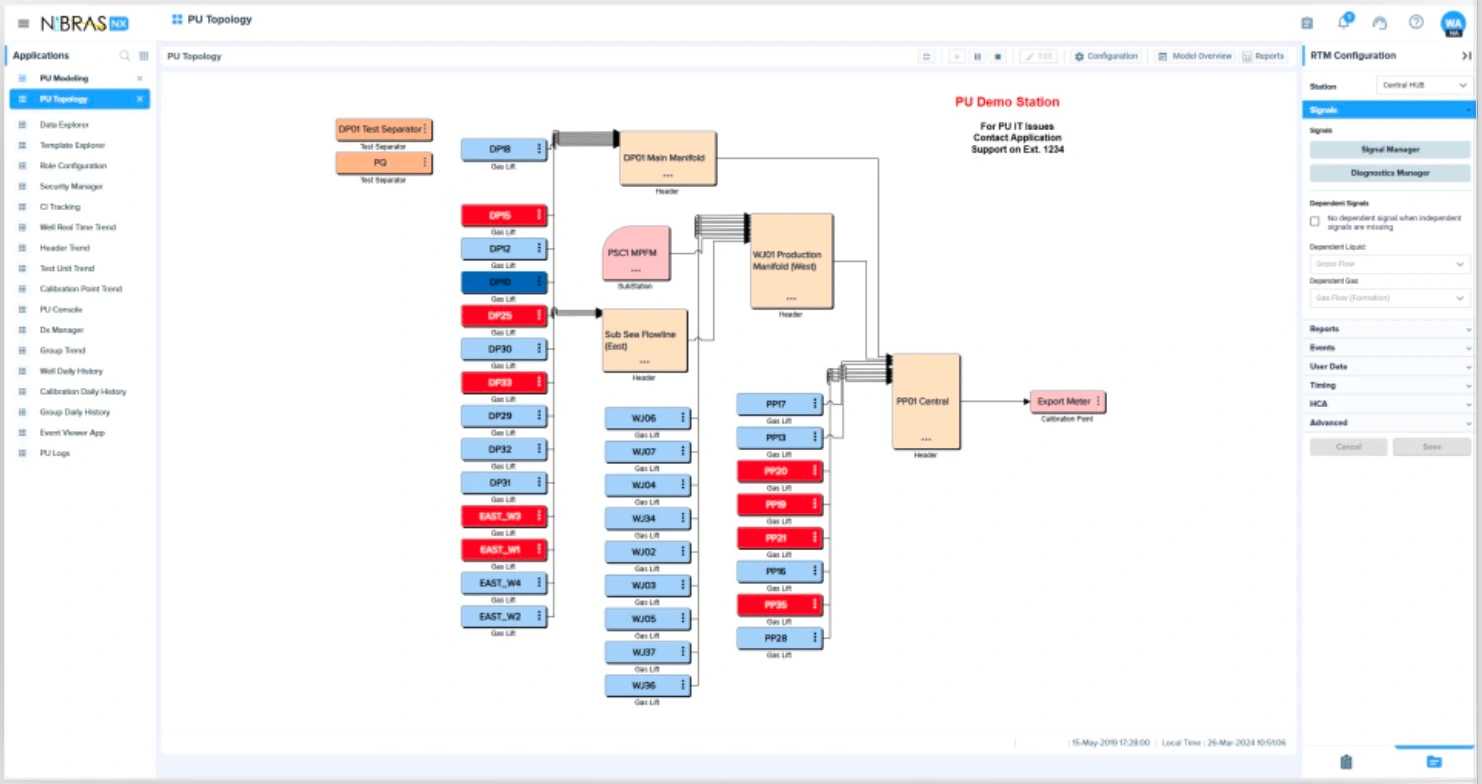
Virtual Metering
25 Years Experience Embedded in a Virtual Metering Tool with Asset Wide Optimization Capabilities
NIBRAS-NX Virtual Metering solution is a machine learning application that runs data driven models to provide real time oil, water and gas estimates for all your wells every 30 seconds. These measurements are reconciled to the export meter so that observed production losses can be tracked down instantly. The tool is designed to deal with poor quality data and is a foundational component for the asset wide optimiser.
ADVANCED FEATURES
- Topology layout with sub stations
- Upstream browsing
- Automatic Header switching
- Auto Loading of well tests
- Well Test Auto Clipping
- Well Test Screening and Validation
- Well Data Modelling screen
- Deliberate Disturbed Well Test Support
- Test by Difference Support
- Poor data quality support
- Fall back models
- Data Pre-Processor functions
- Reconciliation to export meter or fiscal meter
- New production rates every 30 seconds
- Realtime deferment tracking
- Linear/Exponential Decline model support
- Model Sensitivity Analysis
- Model Constraints
- Supports Injectors and Producers wells
- Covers all standard well types (Natural Flowing, ESP, PCP, Gas Lift, Gas, Multi- Zonal, Beam Pump, Gas Injector, Water Injector, etc.)
SUPPORTED INTERFACES
- OSI PI and OPC UA for real time data
- HCA integration for well test data
- Prosper interface for initial well design
- CSV files for simulation data
Registered IP ‘Production Universe’ developed by Shell Global Solutions and commercialized by iNNOVATEQ
STANDARD WELL DATA VISUALIZATION
- Network Visualization with well status
- Real time trending capabilities on
- Export
- Headers
- Wells
- Groups
- Daily History Trends
- Daily/Weekly/Monthly Reporting
- Well Test Loading
- Well Modelling Screen
- Closed-In Pressure Buildup tracking screen
- Fall back configurations
- Reporting and Diagnostic builder
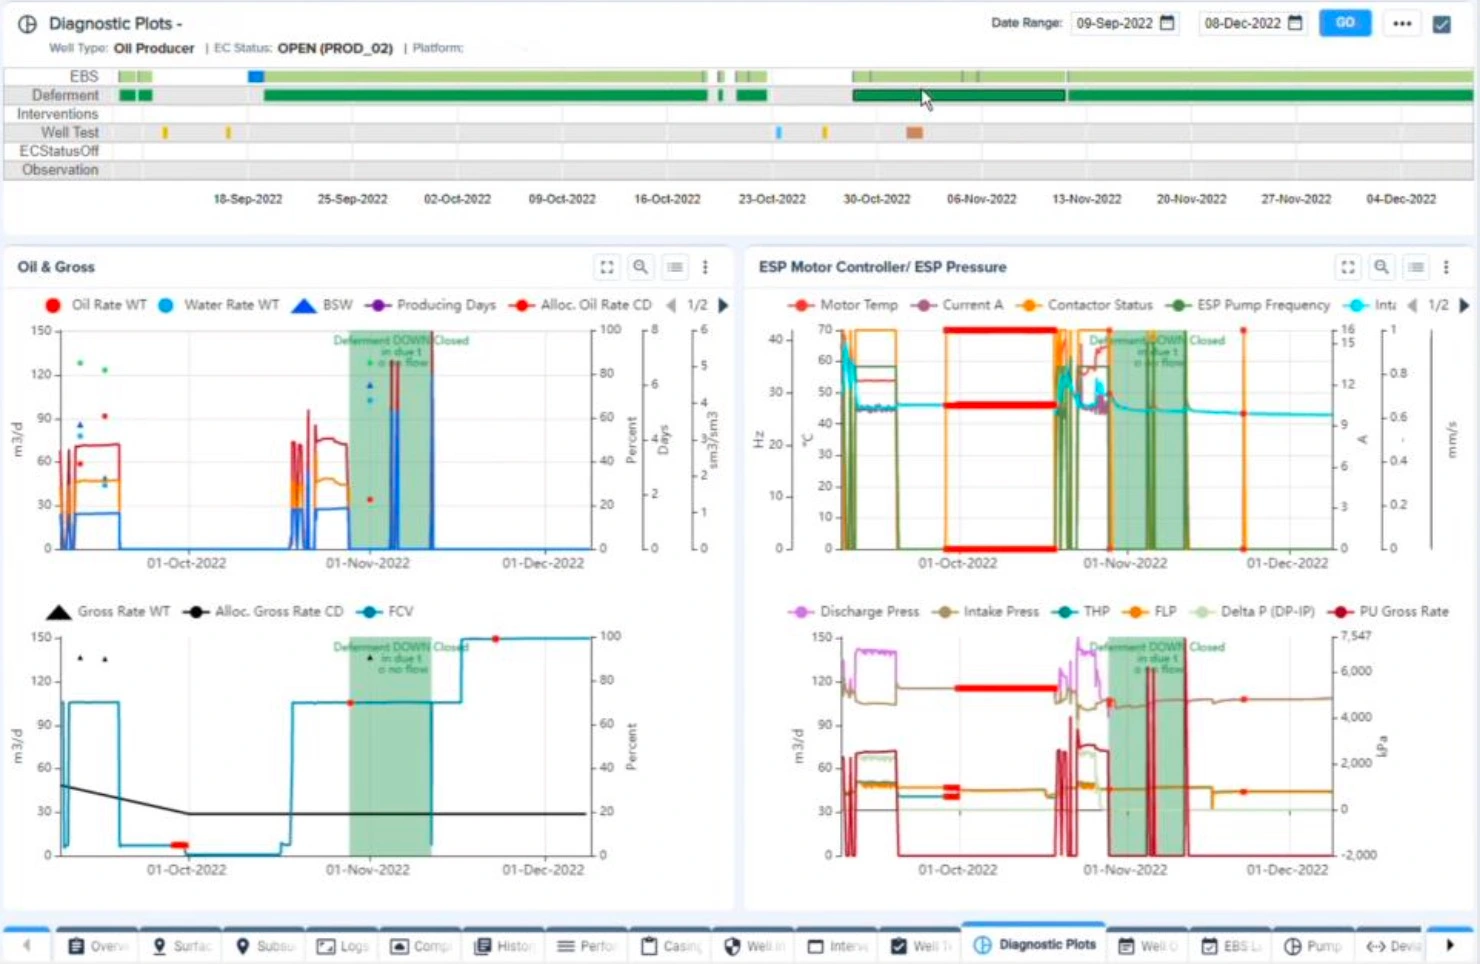
EBM for Wells
Ensure insights are generating business value
NIBRAS-NX Exception Based Management (EBM) solution will create a single task list for each user and tracks the actions taken in the field through human workflows to ensure the business value is realized. Service Level Agreements (SLA’s) visualized in compliance dashboards enable the analysis of the health of your business processes. The platform supports very basic parametric and smart alarms but can also integrate with advanced model based, predictive or AI tools that are creating insights in advanced engineering tools.

ADVANCED FEATURES
- Single task list bringing actions together from different systems
- User assigned actions (or group for rotation positions)
- Standard Operating Procedures embedded
- SLA’s
- Requests actionable offline on the mobile version
- Compliance dashboards
- Action and Request History accessible
- Comments in each step
- Human workflow action review
- Diagnostic plots for immediate trigger analysis
- Events overlayed on real time data trends
- Access to trigger logic to support continuous improvements
- Integrated with E-WellBook for rich context generation (as necessary)
- Integrated with data driven model (Production Universe)
- Integrated with physical models (Prosper, Lowis)
DATA VISUALIZATION
- Task viewer
- Andon Board
- Diagnostic Plots
- Request System
- Human Workflow
SUPPORTED WELL TYPES
- Natural Flowing wells
- Gas Lift wells
- ESP wells
- PCP wells
- Beam pump wells
- Gas wells
- Cyclic Steam wells
- Water Disposal/Injector wells
- Gas Injector wells
Power templates are available but can be customized based on available data
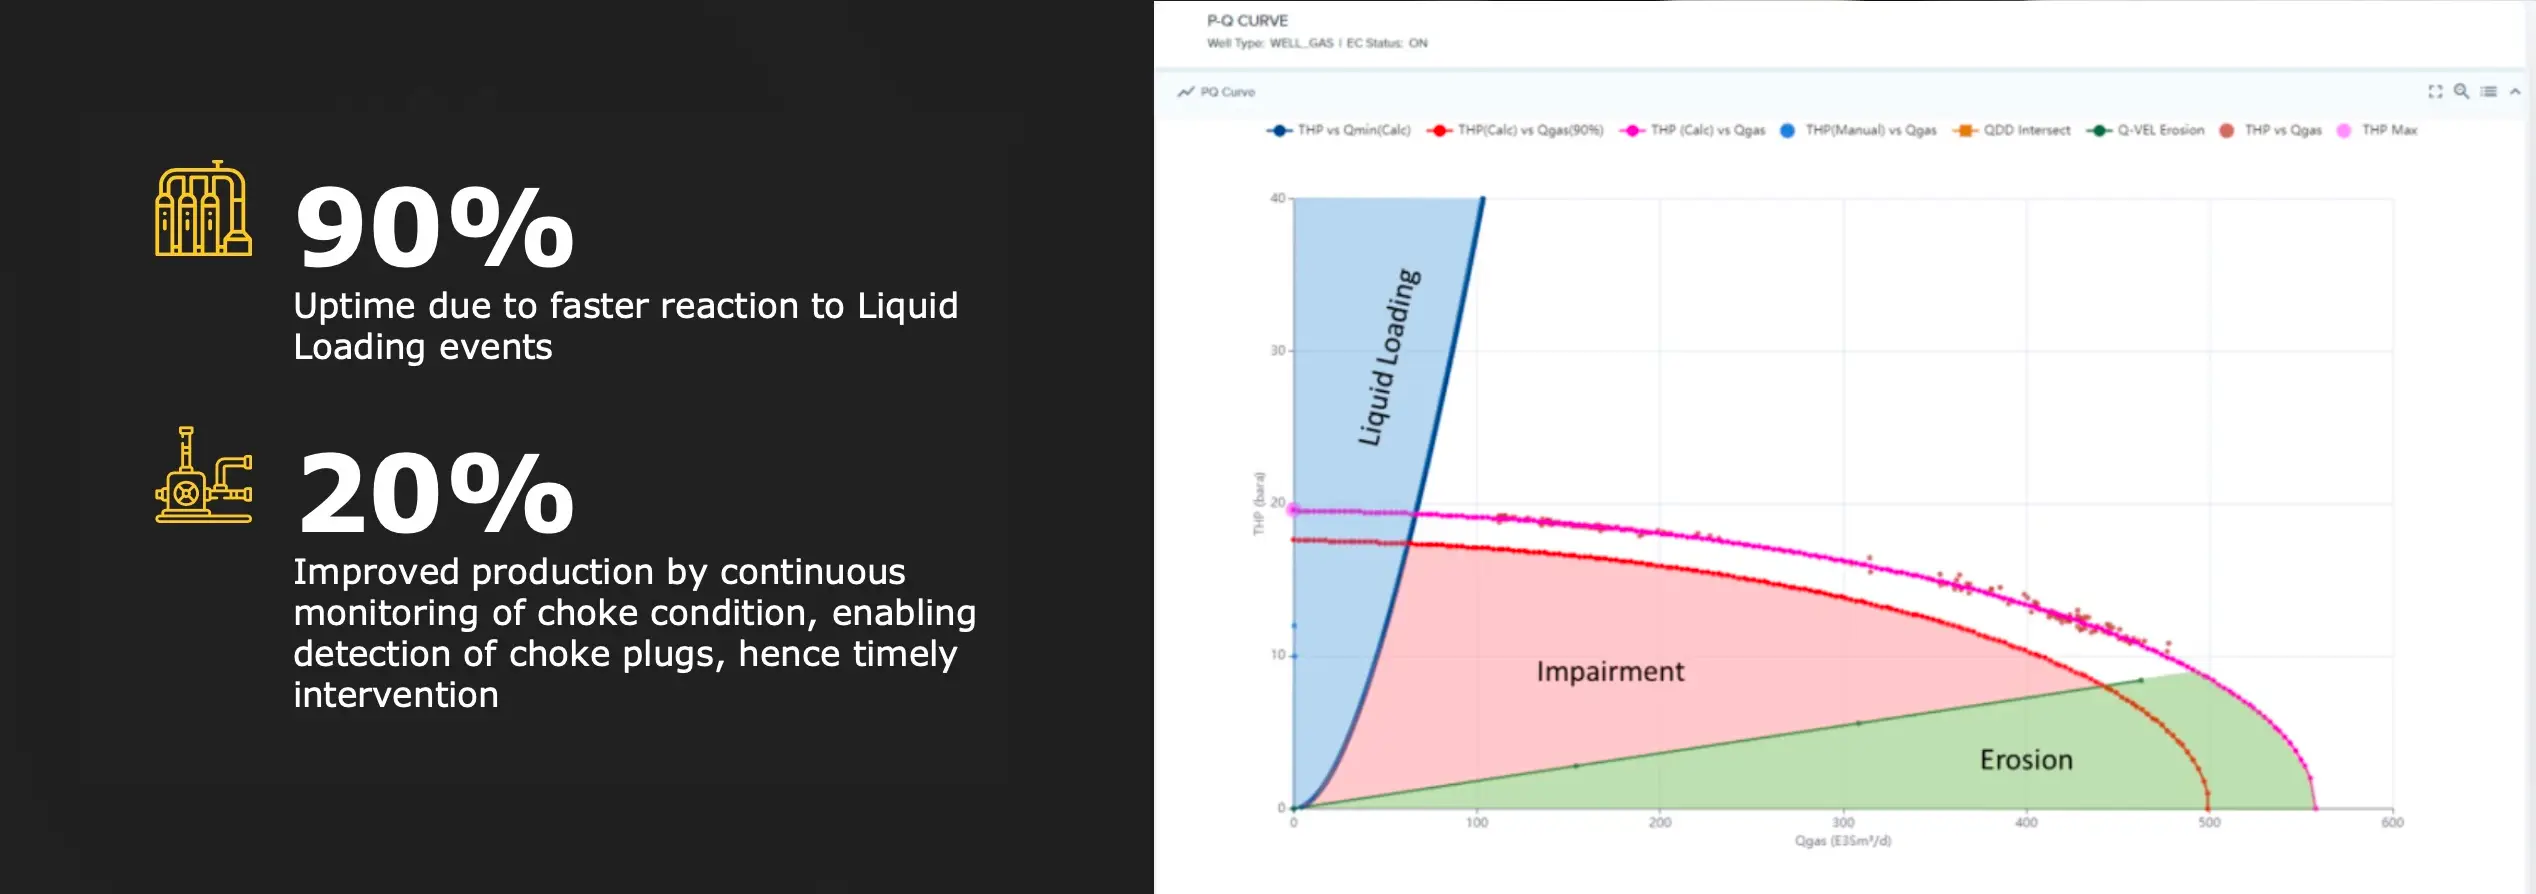
P-Q-Curve
Optimizing gas production within your operating envelopes
Nibras-NX P-Q Curve solution is designed to manage gas well operating envelopes, monitoring and optimisation of the well performance and identification of the production issues related to liquid loading, erosion and productivity impairment.
ADVANCED FEATURES
- Operating Envelope providing the functionality to define and update physics- based models of gas wells using:
- P-Q Curve
- Minimum Flow Rate Limit
- Maximum Flow Rate Limit
- Minimum THP Limit
- Monitoring and optimization by enabling real-time well performance monitoring using production data
- Liquid Loading Monitoring: automating liquid loading detection can help quickly act on liquid loading instances which can lead to increased gas production from the affected wells
- Choke Performance Monitoring: Implementing P-Q curve detection for choke plugs in gas wells allows continuous monitoring and early identification of issues, enabling timely intervention with acid cleaning and improving production
- Exception based surveillance using built-in Nibras-NX functionality can be applied to the model parameters using the operating envelopes to detect events related to liquid loading, erosion and productivity impairment
DATA VISUALIZATION
- P-Q Curve: gas well performance curve at surface conditions, a combination of vertical lift performance (VLP) and inflow performance relationship (IPR)
- Minimum Flow Rate Limit: minimum gas flow rate to avoid liquid loading

- Maximum Flow Rate Limit: maximum gas rate to avoid tubing erosion
- Minimum THP Limit: minimum well operating THP to achieve optimum gas flow rate for a given maximum drawdown
SUPPORTED INTERFACES
- Real-time Data Historian
- Allocation Database
- Relational data (Oracle or SQL)
- Unstructured data
- Restful API’s
- GIS
- SharePoint
- Excel Files
Note: Architecture is open to create custom adaptors to connect to your proprietary applications
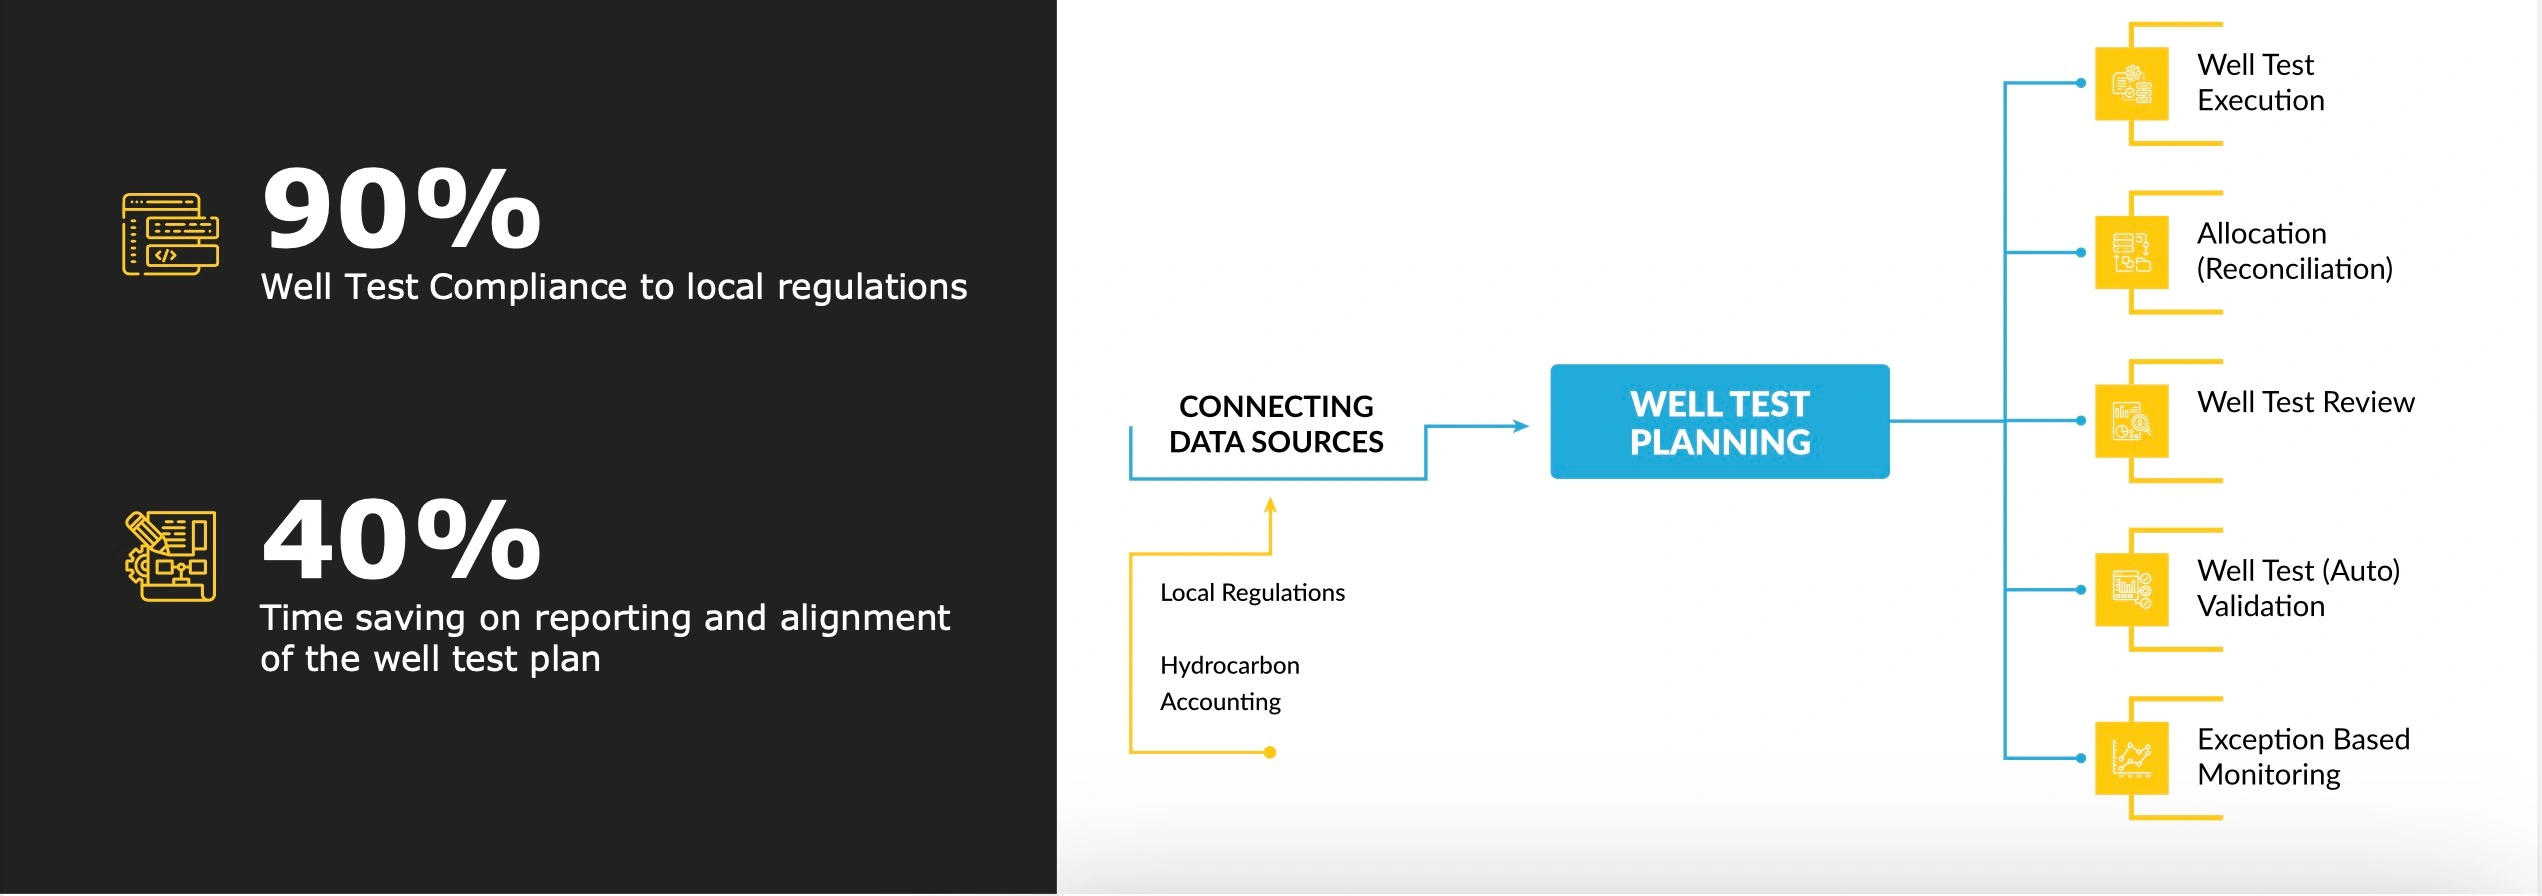
Well Test Planning
Automated Well Testing plans generated from regulatory requirements
Nibras-NX offers end-to-end Well Testing Compliance package which automatically generates a well testing plan for the month based on local regulations that defines testing frequencies based on certain conditions such as production rate. At the same time the tool allows to show other well testing activities been done for operational reasons such as work overs.
ADVANCED FEATURES
- Automatic generated well test plans based on test frequencies set by production rates (and/or other conditions)
- Taking Ad-Hoc tests into account and shifting the times accordingly
- Compliance dashboard against original plan at any moment during the month
- Historical COP compliance grouped by stations to analyse local constraints on testing capabilities
- Well testing results overview of the planned well tests and their deviation from the history.
- Well Test statistics of total number of well test categorized by validation status
- Compliance target tracking
- Report generation based on the hierarchy selection with the option of execution on different levels of the organization.
- Historical reports on test compliance against original plan
SUPPORTED INTERFACES
- Energy Components or any other Hydrocarbon Allocation System
Note: Architecture is open to create custom adaptors to connect to your proprietary applications.
Note: Local regulations tend to have slight deviations, so there will be customizations to ensure that the reporting is done in line with the set KPI’s.
DATA VISUALIZATION
- Well Test Plan per month
- Well Test Results according to Plan
- Overview charts for test compliance

- Analysis chart for additional ad-hoc testing
- Analysis statistics for test execution and validation
- Tabular test compliance by station
- On the desk training for personalised issues
Transfer to Support
- Training for support staff
- Regular governance boards for continuous enhancements
DELIVERABLES
- Platform deployment with basic infrastructure requirements (User/Role Access, data access, process compliance, etc.)
- Functional requirements documentation for solutions
- Digital solutions deployed on Nibras NX platform
- Platform and solution training
- Low code support tools
- User manual and project documentation
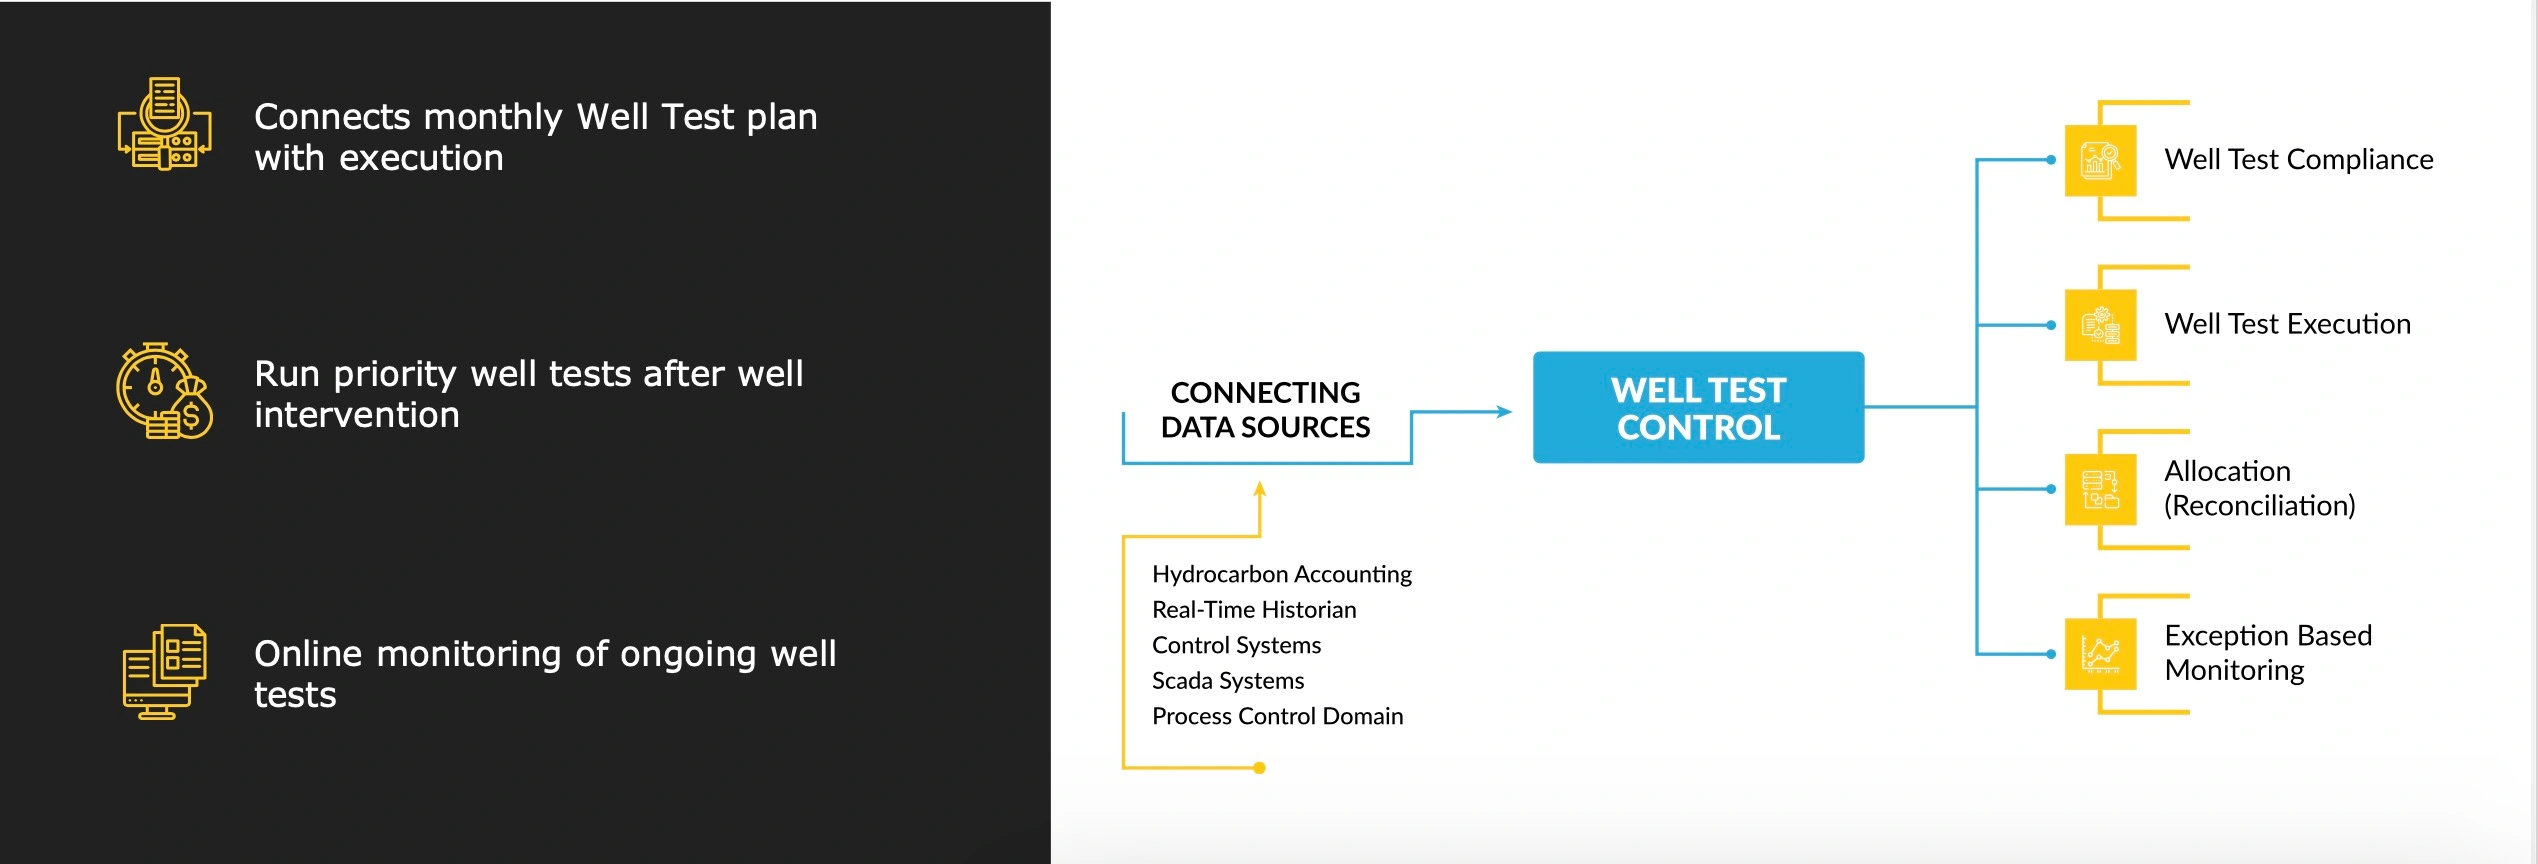
Well Test Control
Your Tagline Goes Here
NIBRAS-NX Well Test Control will extract from the well test planning tool a well test schedule per test unit and pass it on to the control system for execution. The operator is enabled to intervene and change the schedule based on operational requirements which will also feedback in the well test compliance management tool
ADVANCED FEATURES
- Integration with monthly plan; assignment of well test sequence per test unit
- Integration with 3rd party control system (DCS or Weatherford Lowis) to execute control
- Communication of densities for net oil computer calculation
- Setting of purge and test times
- Running priority well tests after wells have had an intervention
- Integration with deferment system to skip wells from the well test sequence
- Integrated in human workflow for any update to the sequence
SUPPORTED DATA TYPES
- Real-time Data Historian
- Relational data (Oracle or SQL)
- Unstructured data
- Restful API’s
- GIS
- SharePoint
- Excel Files

Note: Architecture is open to create custom adaptors to connect to your proprietary applications
STANDARD WELL DATA VISUALIZATION
- Well Test Status report
- Well Test Control screen to start sequence and run priority tests
- Test Unit Overview screen to see running units
- Test Unit status screen with online trends of test unit and wells
- Well Test History report to see completed well test history
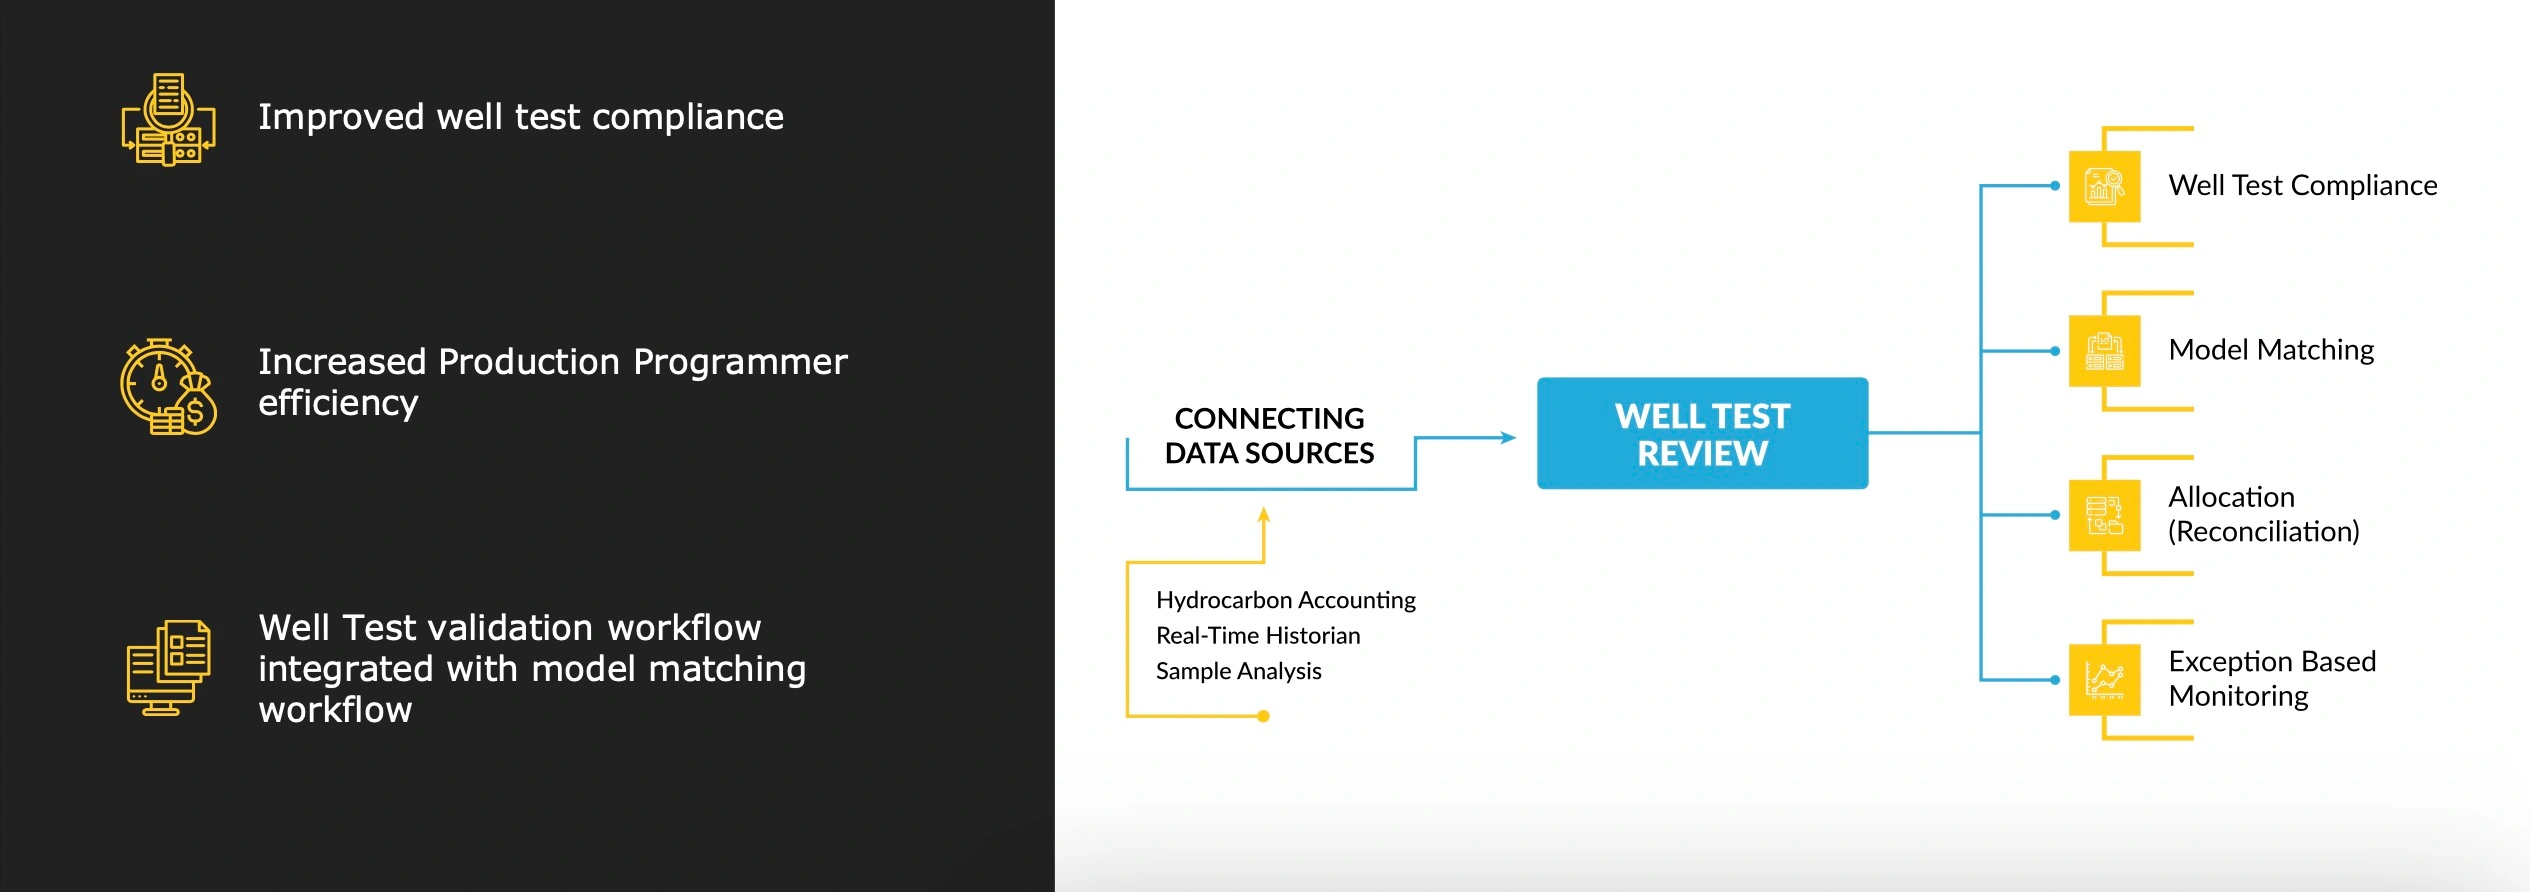
Well Test Review
Well Test validation embedded in a rich data review process
NIBRAS-NX Well Test review is a mini review process which allows you to manually validate all your available well tests at once and select the most accurate for acceptance to comply with your well testing regulations. Better well test selection will also improve reconciliation factors and increase accuracy of model matching workflows.
ADVANCED FEATURES
- Review full list of available well tests including validated well tests
- Lock well test status when used for months allocation purpose
- Clipping of well tests for removal of unstable well test time windows
- Review of well and test unit parameter real time data within one comprehensive overview with well parameter list dynamic based on well type
- Updating of well test results used mostly to enter sample data such as water cut.
- Real time data trends overlayed with events data
- Observation logging
- PDF data reporting for each well review for future reference
SUPPORTED DATA TYPES
- Real-time Data Historian
- Relational data (Oracle or SQL)
- Unstructured data
- Restful API’s
- GIS
- SharePoint
- Excel Files
iNNOVATEQ COMMITS TO A SUCCESSFULL DEPLOYMENT OF YOUR DX ROADMAP

Note: Architecture is open to create custom adaptors to connect to your proprietary applications.
STANDARD WELL DATA VISUALIZATION
- Well Test history per well
- Real time Test Unit Trends
- Real Time Well Parameter Trends
- Well Testing details
- Variation Calculation for data updates
- Hydrocarbon Accounting Data
- Sample Management Data
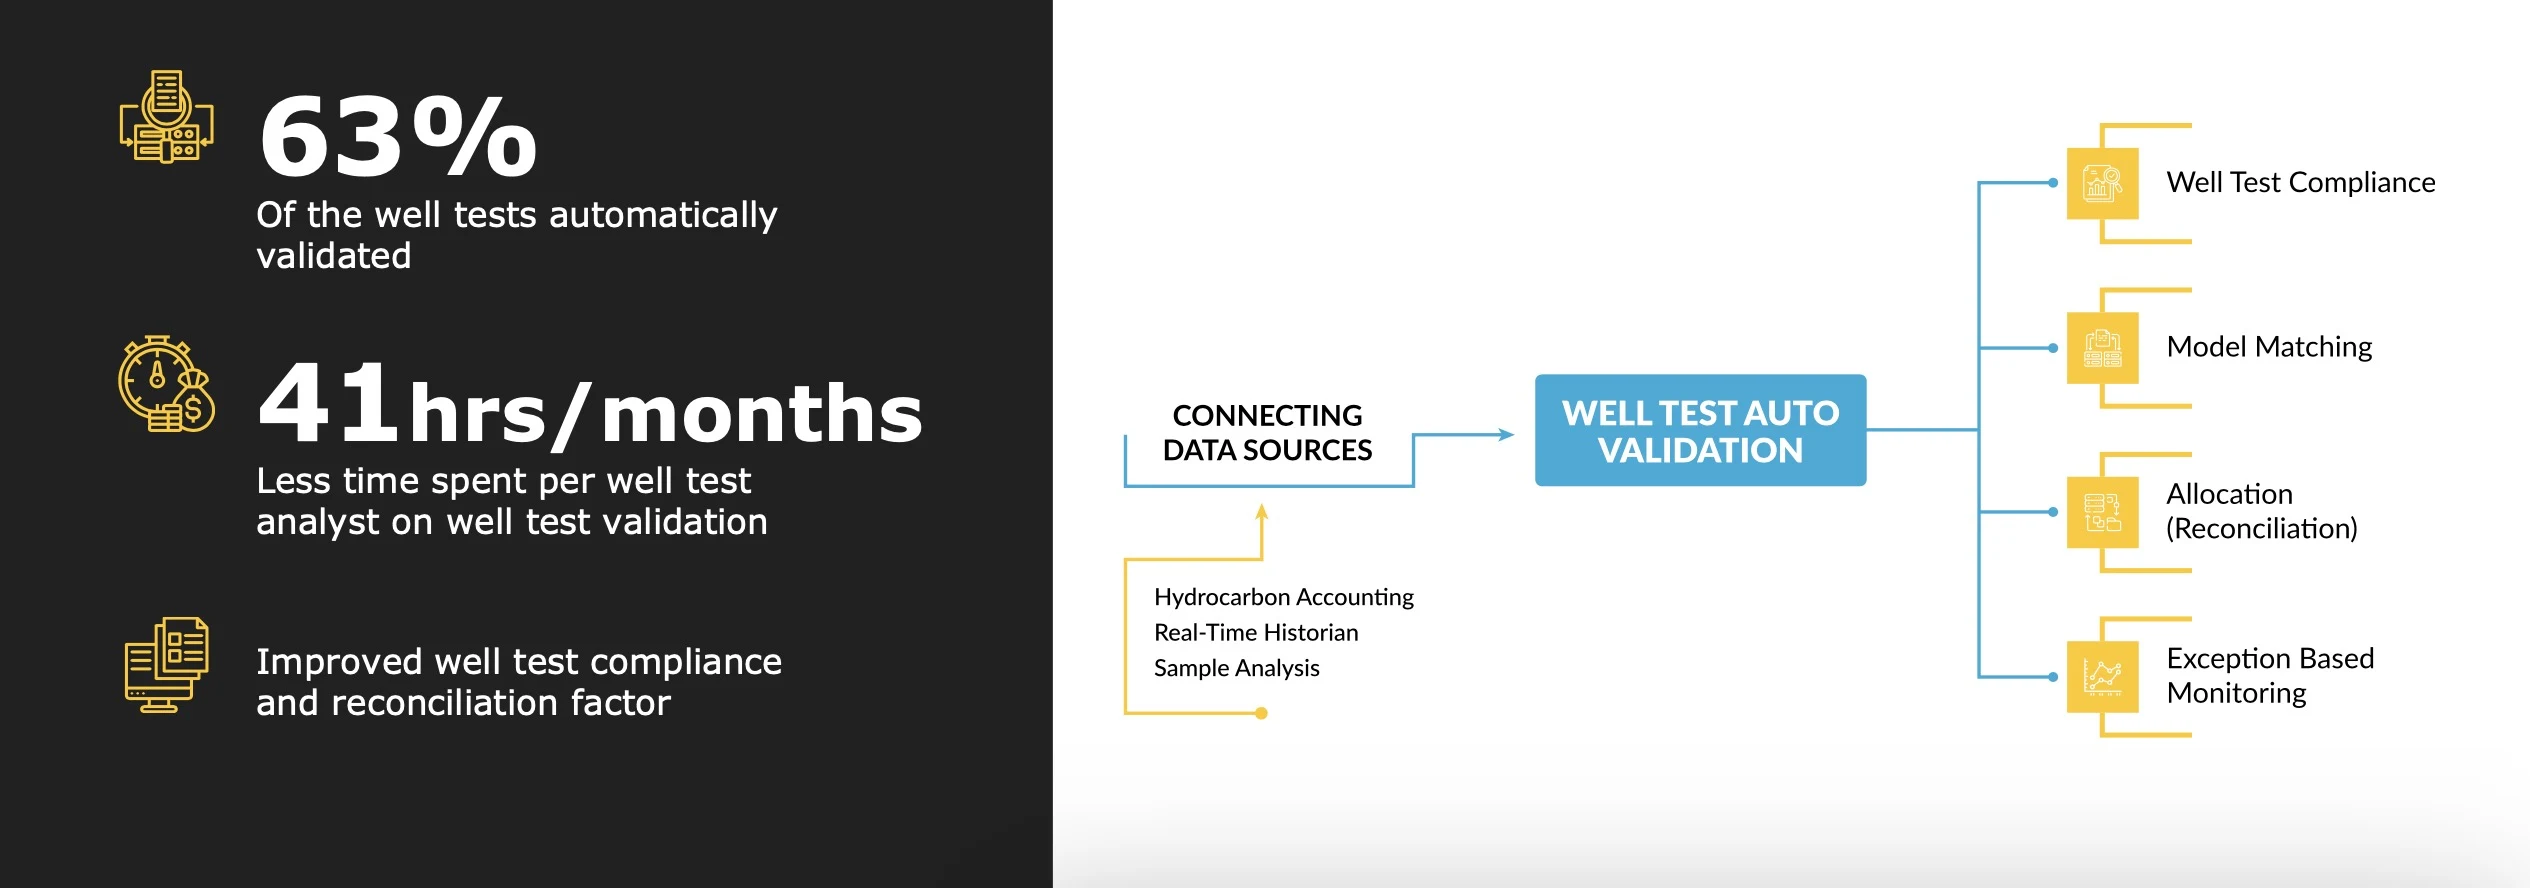
Well Test Auto Validation
Enhances your focus on wells with changing operating conditions
NIBRAS-NX Well Test Auto validation is an algorithm which will validate well tests that are in-line with the well history and hence confirmed to run stable. This allows your engineers to focus on the wells that are changing behavior and do a more in-depth human analysis.
ADVANCED FEATURES
- Those wells which are not showing a behavioral change compared to their own history will get an updated well test validation status (either accept or reject)
- Those wells which are changing behavior compared to their own history will be scheduled for a manual validation
- Validation algorithm based on:
- Booked deferments
- Well Test Duration
- Pump Efficiency
- BSW history
- Gross history
- Oil history
- For those wells which are validated, the updated well test status can be seen in the hydrocarbon allocation system
SUPPORTED DATA TYPES
- Real-time Data Historian
- Hydro carbon Allocation system
- Sample data
- Well and Test Unit Parameters

STANDARD WELL DATA VISUALIZATION
- This tool is an algorithm that is running in the background usually once or twice per day.
- Integrated with human workflows to request for manual well test
- Integrated with human workflows to do manual well test validation in case auto validation is uncertain
Note: Architecture is open to create custom adaptors to connect to your hydrocarbon allocation system and data historian
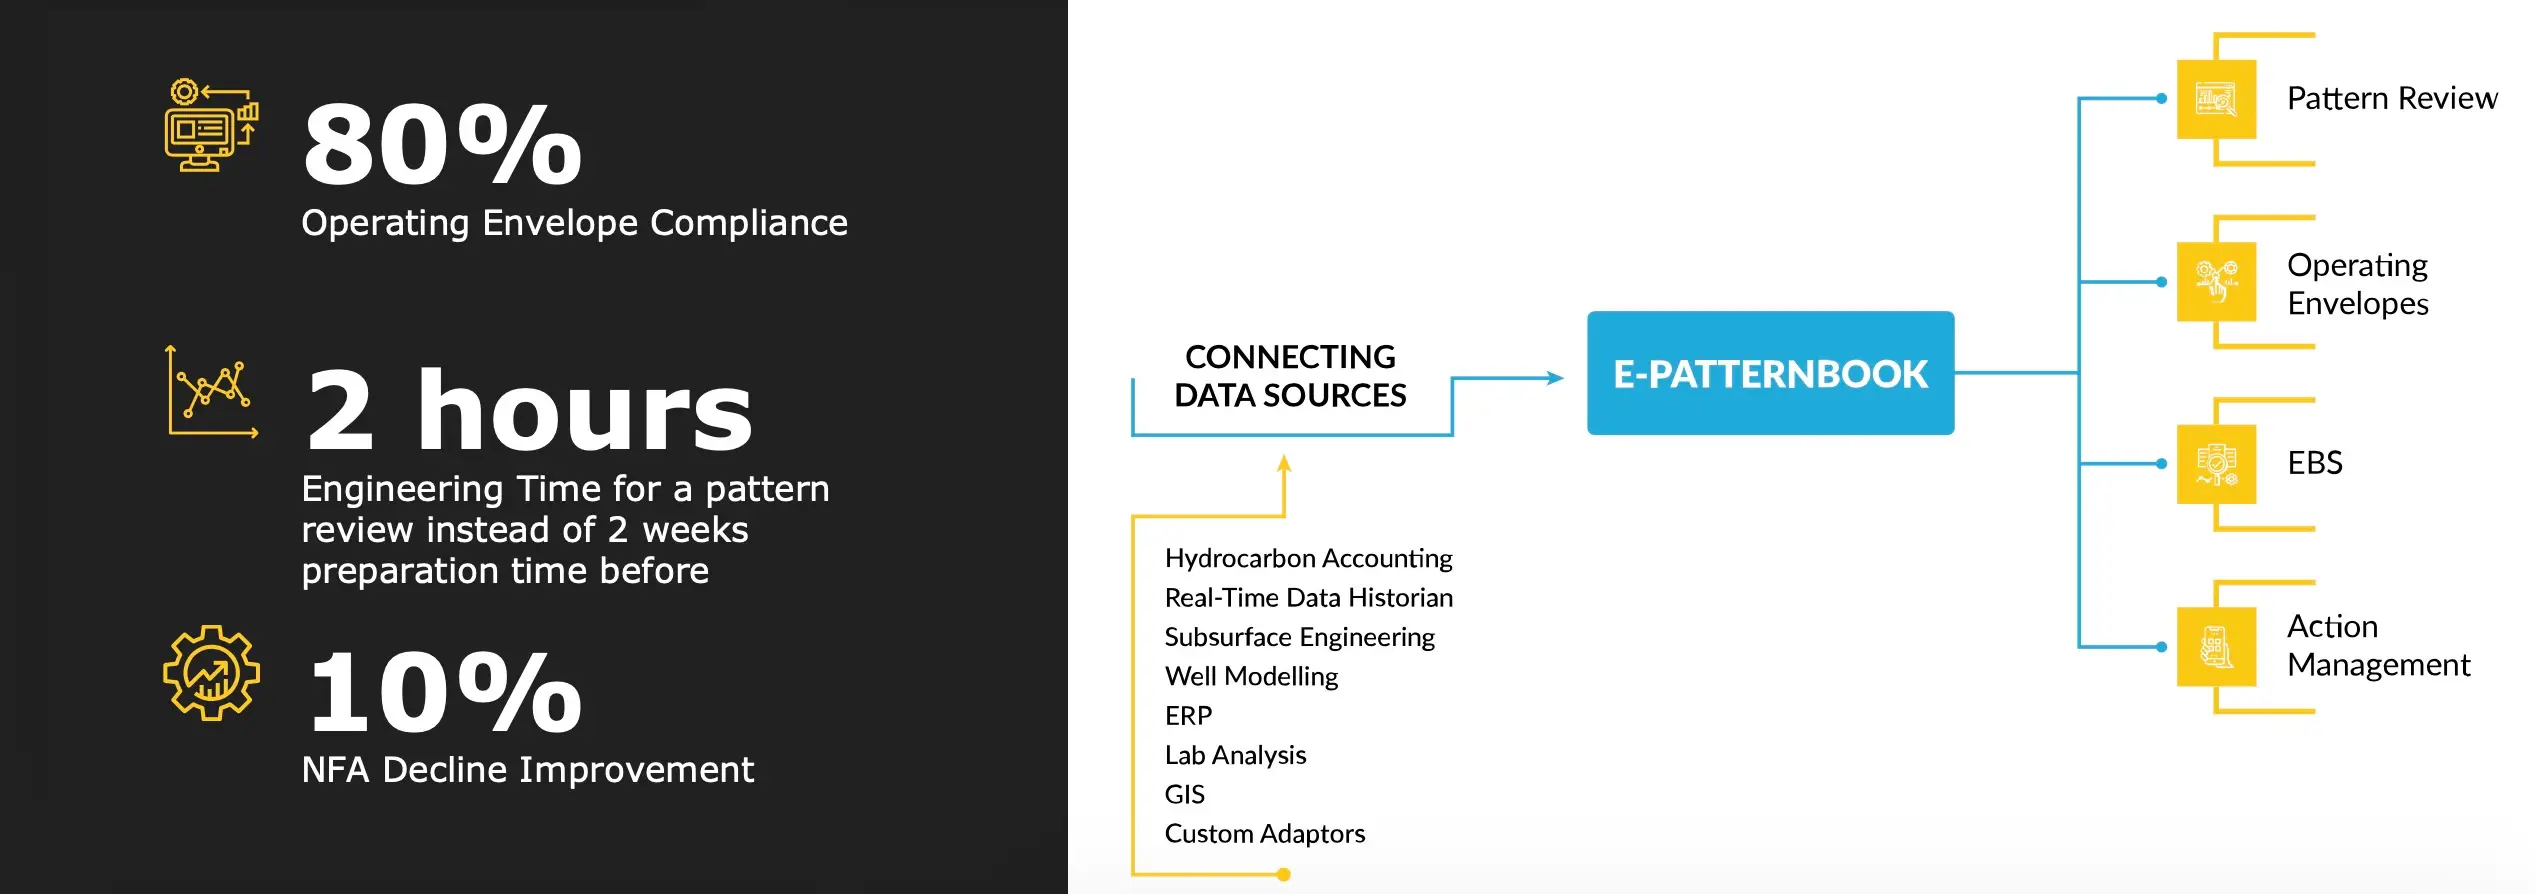
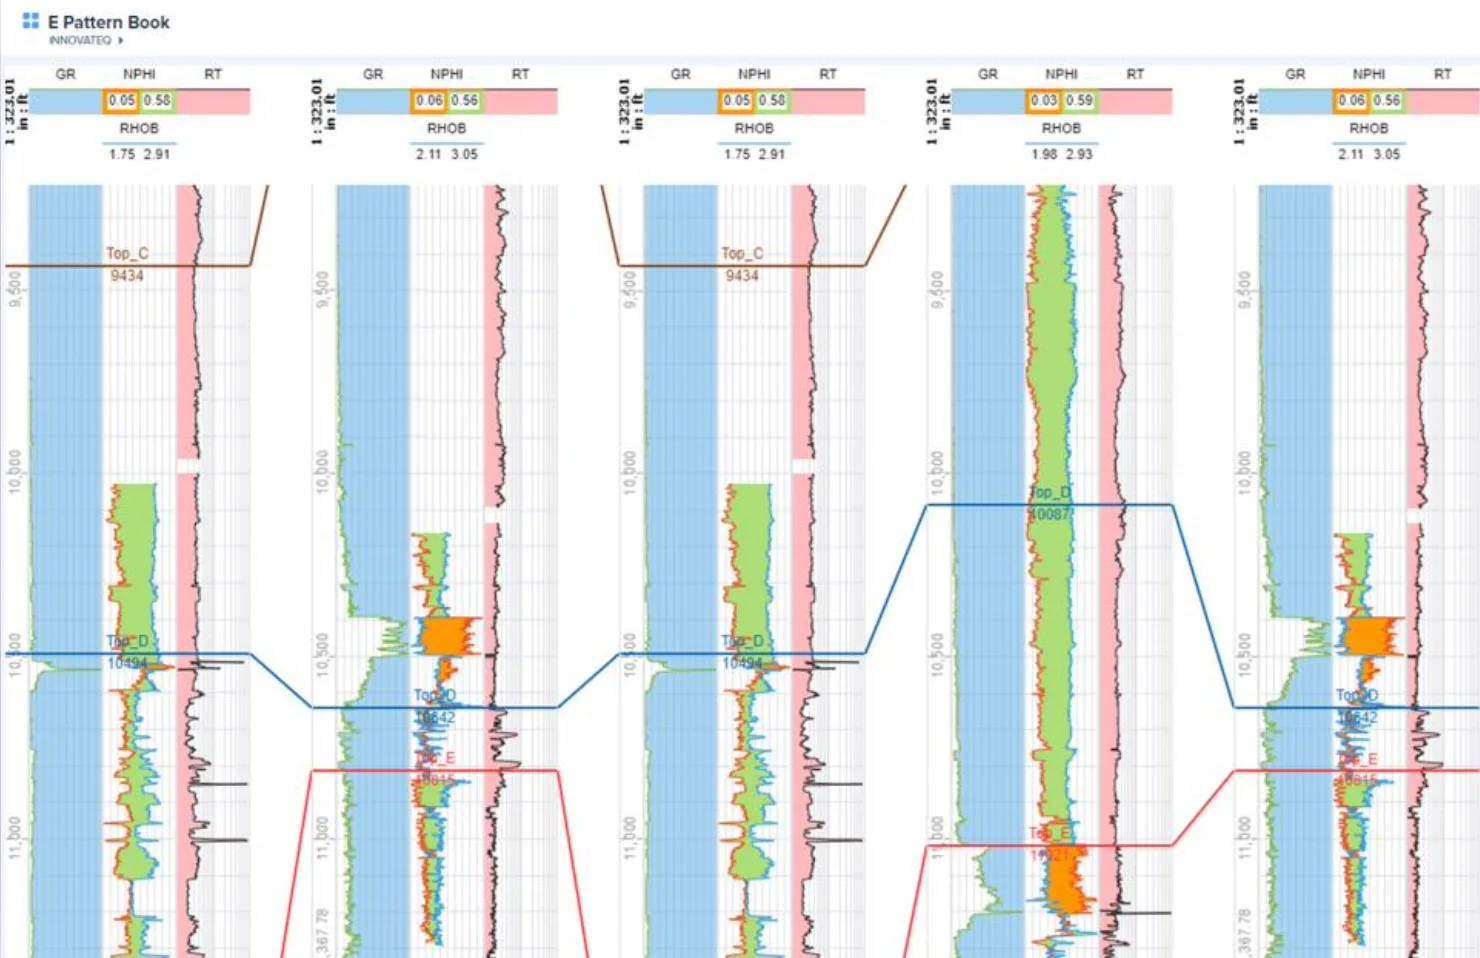
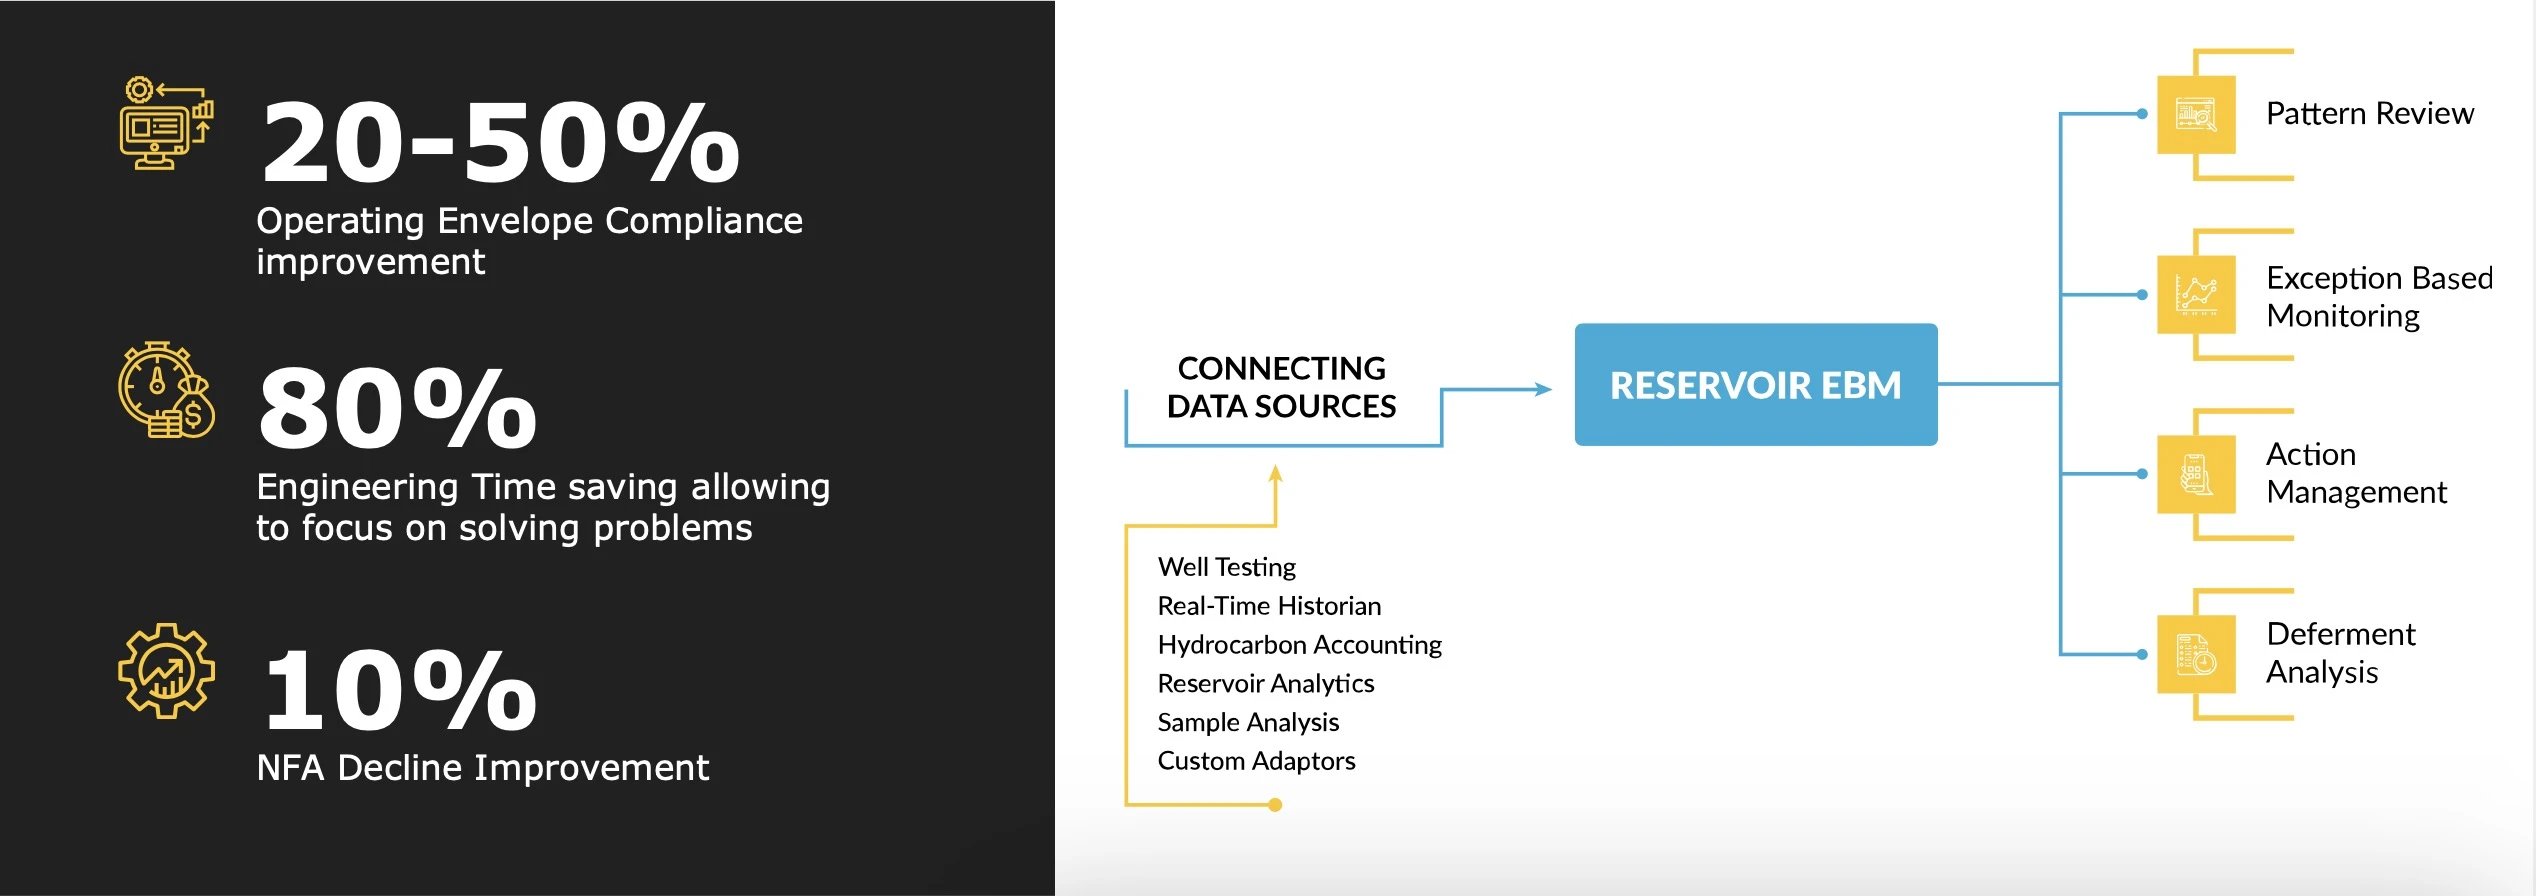
E-Pattern Book
Portfolio Overview of Reservoir Pattern Performance at a Glance
NIBRAS-NX E-PatternBook provides valuable insights into the reservoir performance to the reviewers. It allows engineers to quickly access and analyze the data related to the historical reservoir pattern performance, such as injection and production rates, reservoir pressure trends, voidage and IVRR. This information helps to identify opportunities for production optimization and make informed decisions about well and reservoir management.
ADVANCED FEATURES
- Pattern Configuration Wizard
- Pattern Health and Ranking
- Completion Matrix
- Pattern Correlation Panels
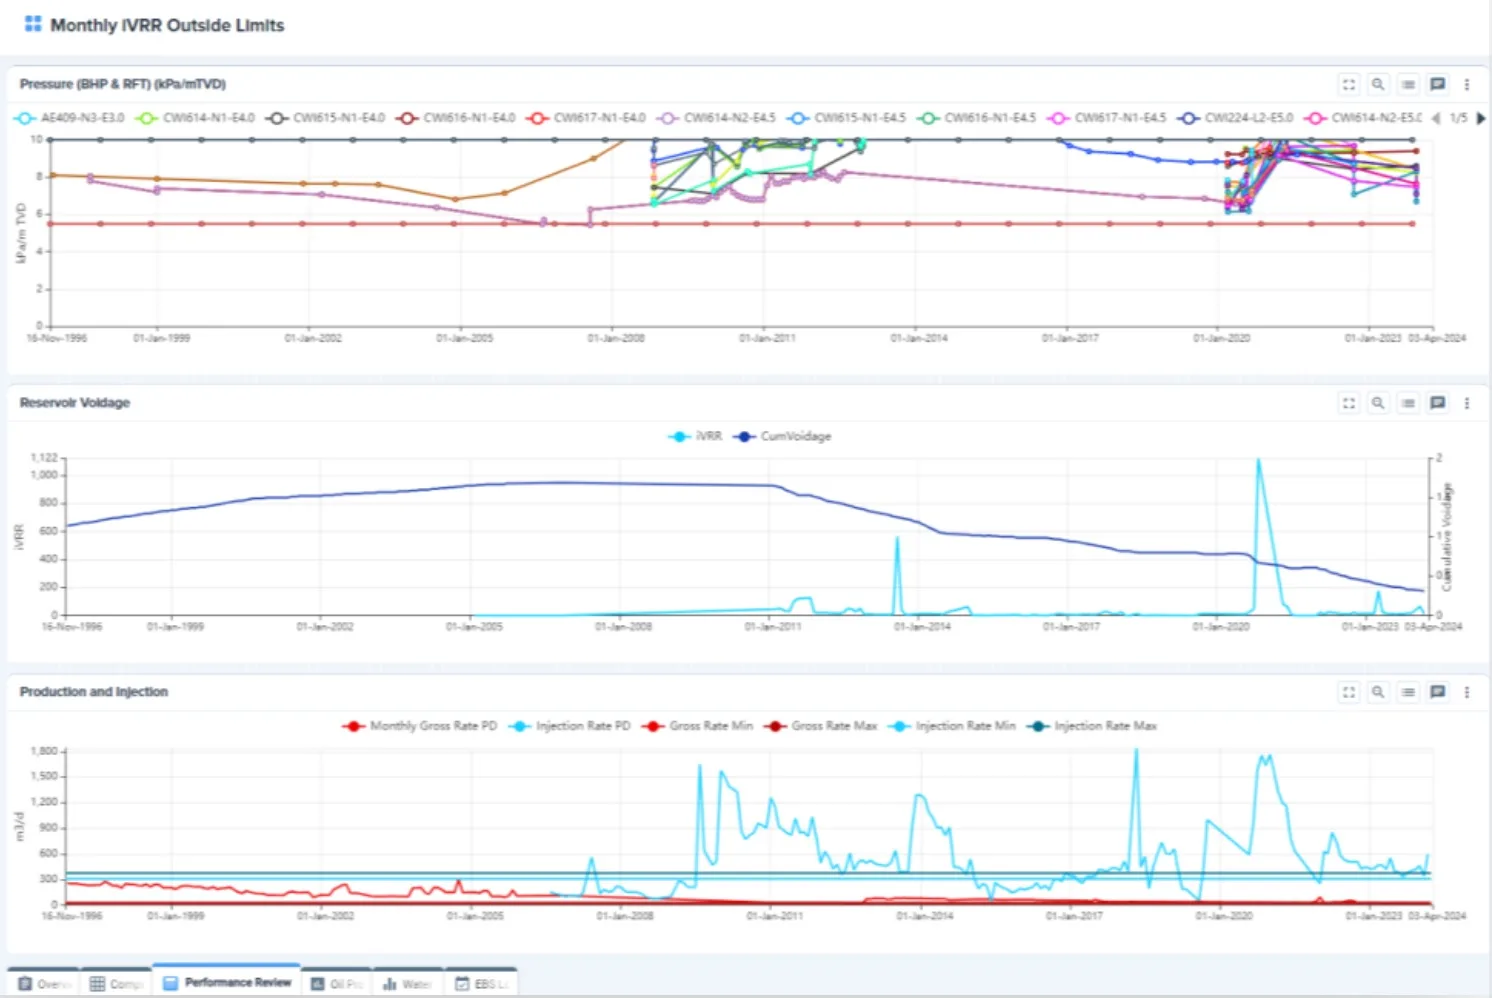
- Reservoir Voidage and IVRR
- Hall Plots
- Integration of Reservoir Simulation Model Data
- Quick Links to E-WellBook
- Pattern Review Audit Trail
- Management of Threats and Opportunities
- Action Tracker
SUPPORTED DATA TYPES
- Real-time Data Historian
- Allocation Database
- Relational data (Oracle or SQL)
- Unstructured data
- Restful API’s
- GIS
- SharePoint
- Excel Files
Note: Architecture is open to create custom adaptors to connect to your proprietary applications
RESERVOIR DATA VISUALIZATION
- Reservoir Pattern Status Information
- Operating Envelope
- Reservoir Connections
- Production/Injection and Reservoir Pressure History
- Reservoir Maps
- Well Logs
- Fluid and Production Chemistry Data
- Reservoir Analytics Data
- Reservoir Simulation Model Data
- Operating Envelope Limits and Settings
EBM for Water Flooded Reservoirs
Ensure insights are generating business value
NIBRAS-NX Exception Based Management (EBM) solution will create a single task list for each user and tracks the actions taken in the field through human workflows to ensure the business value is realized. Service Level Agreements (SLA’s) visualized in compliance dashboards enable the analysis of the health of your business processes. The platform support very basic parametric and smart alarms but can also integrate with advanced model based, predictive or AI tools that are creating insights in advanced engineering tools.
ADVANCED FEATURES
- Single task list bringing actions together from different systems
- User assigned actions (or group for rotation positions)
- Standard Operating Procedures embedded
- SLA’s
- Requests actionable offline on the mobile version
- Compliance dashboards
- Action and Request History accessible
- Comments in each step
- Human workflow action review
- Diagnostic plots for immediate trigger analysis
- Events overlayed on real-time data trends
- Access to trigger logic to support continuous improvements
- Integrated with E-PatternBook for rich context generation (as necessary)
DATA VISUALIZATION
- Task Viewer
- Andon Board
- Diagnostic Plots
- Request System
- Human Workflow
SUPPORTED RESERVOIR TYPES
- Depleted reservoirs.
- Water flooded reservoirs.
- Gas flooded reservoirs.
- WAG reservoir
Power templates are available but can be customized based on available data.
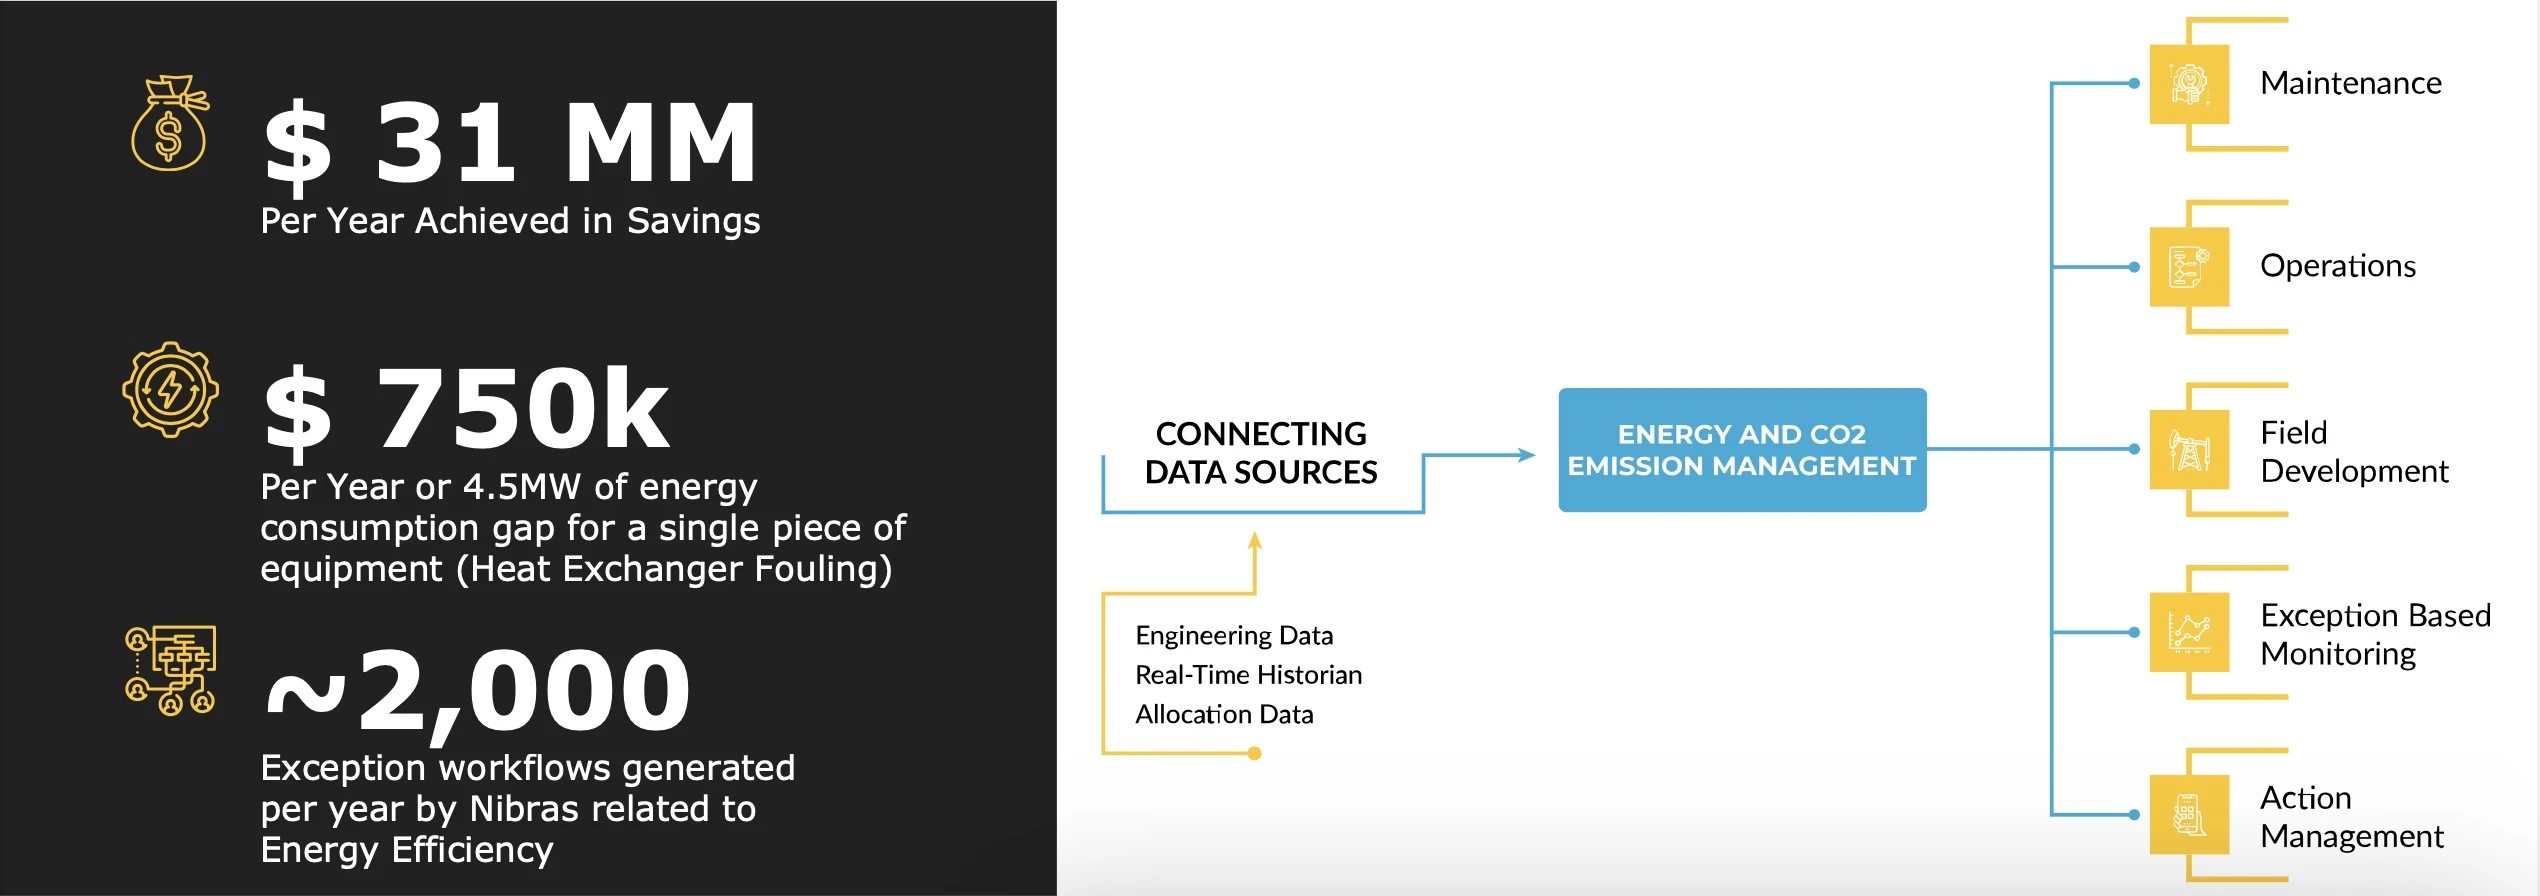
Energy and CO2 Emission
Your energy losses ranked and visualized in dollars
Nibras offers a comprehensive energy and CO2 emissions monitoring solution that utilizes “Follow the Money” approach, integrating seamlessly into human workflows, employing exception-based management, and providing detailed reporting capabilities. By becoming integrated, multi-disciplined, standardized, and “Smart,” Nibras enables early threat and opportunity identification, prioritization and mitigation seamlessly integrated to its existing equipment monitoring solutions.
ADVANCED FEATURES
- Energy and CO2 emission EBM seamlessly integrated to other EBM logic
- Definitions and democratization of operating envelopes and operating windows according to your organization’s conventions, where changes create an audit-trail
- Deployment consultancy support to help establish competitive, yet achievable targets
- Automated KPI tracking system
- Automating the assignment of actions related to the relevant roles.
- Accessibility of exceptions, diagnostic plots, and historical actions in one system
- User assistance in resolving Energy Efficiency gaps identified by having SOP’s attached for each of the types of exceptions generated by Nibras
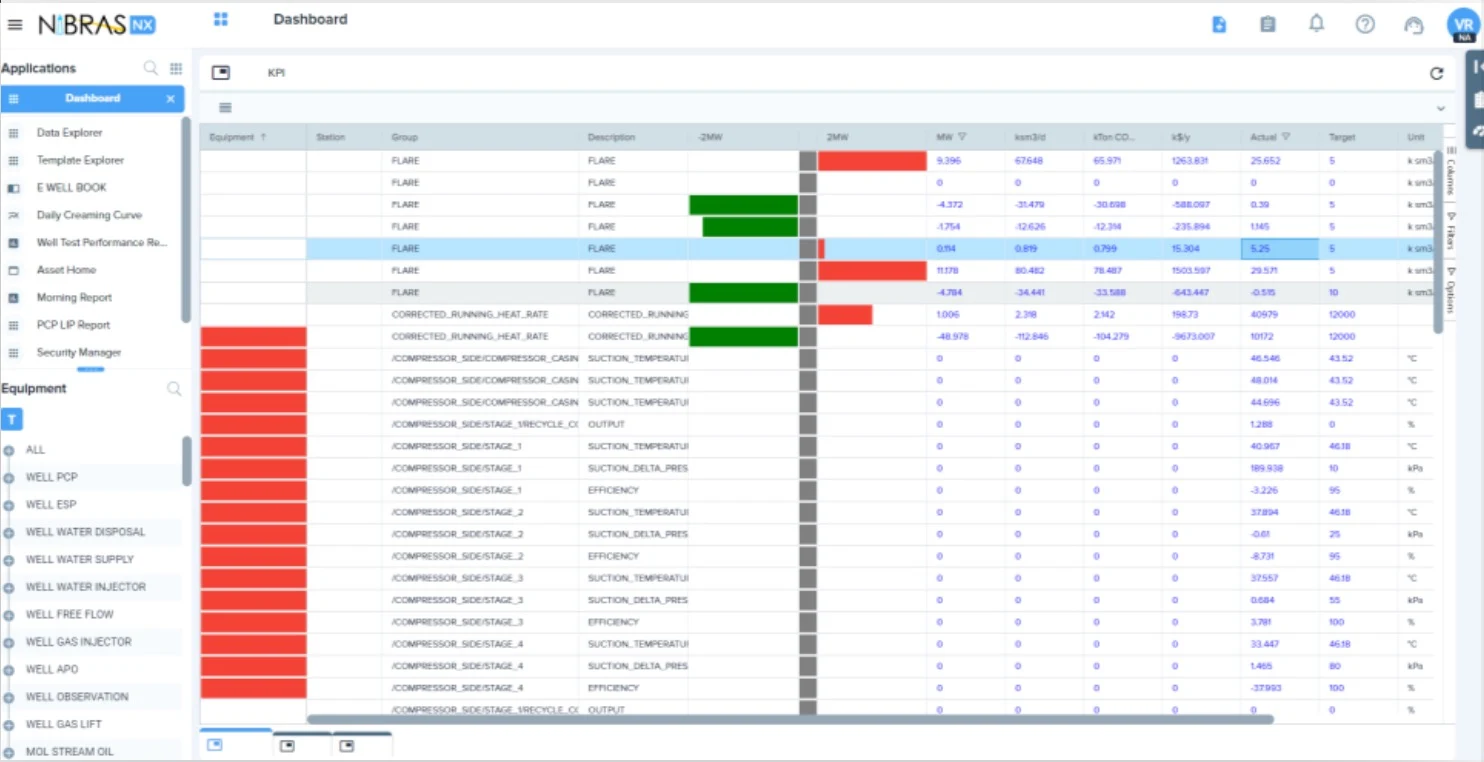
- Implementation of ‘Follow-the-Money’ approach, whereby each energy efficiency opportunities and threats are automatically translated into a dollar value by Nibras.
- Automated classification of energy efficiency components by their ‘driver’ (e.g. Flare, Operational, Structure, Maintenance).
- Capex intensive opportunities and threats can be transferred into the Nibras-NX MTO Module
VISUALIZATION TOOL
- Diagnostic Plots
- Energy and CO2 Emission Reports per Equipment Type
- Dashboards by ‘Energy Driver’
- Andon Board (Business Process Monitoring Tools)
- Energy Emission Dashboard
- “Bad Actors” Report
iNNOVATEQ COMMITS TO A SUCCESSFULL DEPLOYMENT OF YOUR DX ROADMAP
EQUIPMENT TYPES—POWER TEMPLATES
- Compressors
- Pumps
- Flares
- Heat Exchangers
- Blowers
- Furnaces
- HSRG/OTSG
- Columns
DEPLOYMENT APPROACH
- Shortlist equipment relevant to Energy Efficiency Monitoring
- Define Energy Drivers
- Select Equipment Parameters required to be monitored
- Align on target values
- Automate Gap calculations
- Generate visualisations for the new data generated
Operator Standard Work
Built, Operate and Transfer to your support organization to continuously adapt to your future
Deployment Services are intended to efficiently deploy all digital solutions in the Dx roadmap on the NibrasNX platform using low code deployment tools. Experts focus on business logic while commodity tasks such as labor-intensive data mapping is institutionalized in your support organization. By gradually transferring the ownership of the deployment to your organization, we ensure the continuous improvement culture is supported and we allow you to achieve your local content requirements.

TYPICAL CORPORATE CHALLENGES
- 70% of the time is spent on mapping data
- Different tools use different data sources for the same information
- Solutions cannot be customized to your needs
- Performance issues when scaling
- Tool is not embedded in your work process
- Experts needed to deploy solutions
KEY ACTIVITIES
Business Process Standardisation (Business Transformation Services)
- Best practice alignment across different assets
- Standardised business processes
- Requirements documentation Digital Process Deployment
- Data mapping to data sources
- Advisory services for data warehousing
- Process configuration
- Dashboard configuration
- Custom development
Acceptance Testing
- Classroom training
- Factory acceptance testing per solution
- Site acceptance for each asset replication
- Prioritized feature register for continuous improvement
Intensive Support
- Daily “clinic” sessions for immediate support
iNNOVATEQ COMMITS TO A SUCCESSFULL DEPLOYMENT OF YOUR DX ROADMAP
- On the desk training for personalised issues
Transfer to Support
- Training for support staff
- Regular governance boards for continuous enhancements
DELIVERABLES
- Platform deployment with basic infrastructure requirements (User/Role Access, data access, process compliance, etc.)
- Functional requirements documentation for solutions
- Digital solutions deployed on Nibras NX platform
- Platform and solution training
- Low code support tools
- User manual and project documentation
Permit to Work
Digital PTW to ensure the work is done on the right location
NIBRAS-NX PTW supports both desktop as mobile applications and workflows. Work Permits can be raised directly from a mobile device, and synched back to the back-end servers once connected to the network
ADVANCED FEATURES
- Offline capabilities
- Request Outbox
- Enabled on Android and iOS
- Encrypted server data communication
- User based login
- Camera Access for picture upload
- Voice note recording part of audits
- Auto Location tracking on workflow submission
- Human workflow actions
- Task listing
- Future task scheduling
- Multiple user profiles and roles for personalized views
- Advanced task filtration capabilities
- Compliance dashboards
SUPPORTED BY
- Android / iOS / Web support
- Zone EX1 and EX2 tables support
- MDM integration (Device Management)
- Secured application access
- SQL Lite data caching
- Integrated network diagnostic
iNNOVATEQ COMMITS TO A SUCCESSFULL DEPLOYMENT OF YOUR DX ROADMAP

Note: Architecture is open to create custom adaptors to connect to your proprietary applications
STANDARD AVAILABLE WORKFLOWS
- Permit to Work checklist
Note: Data visualization can be customized based on available data
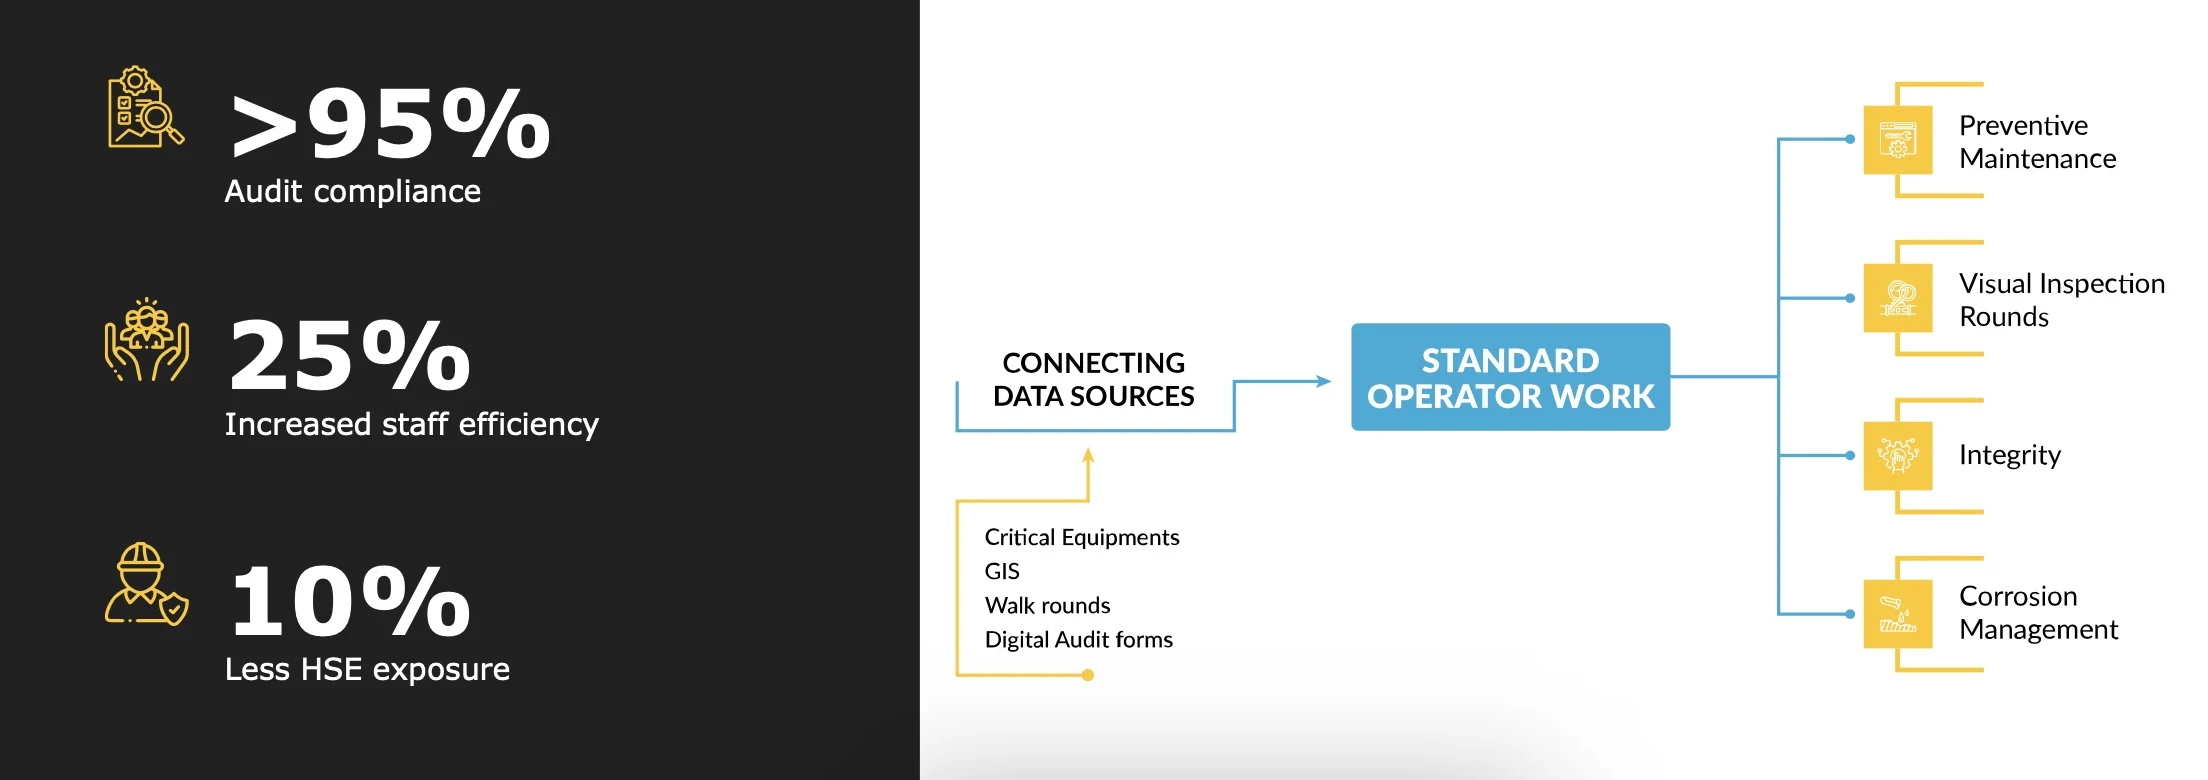
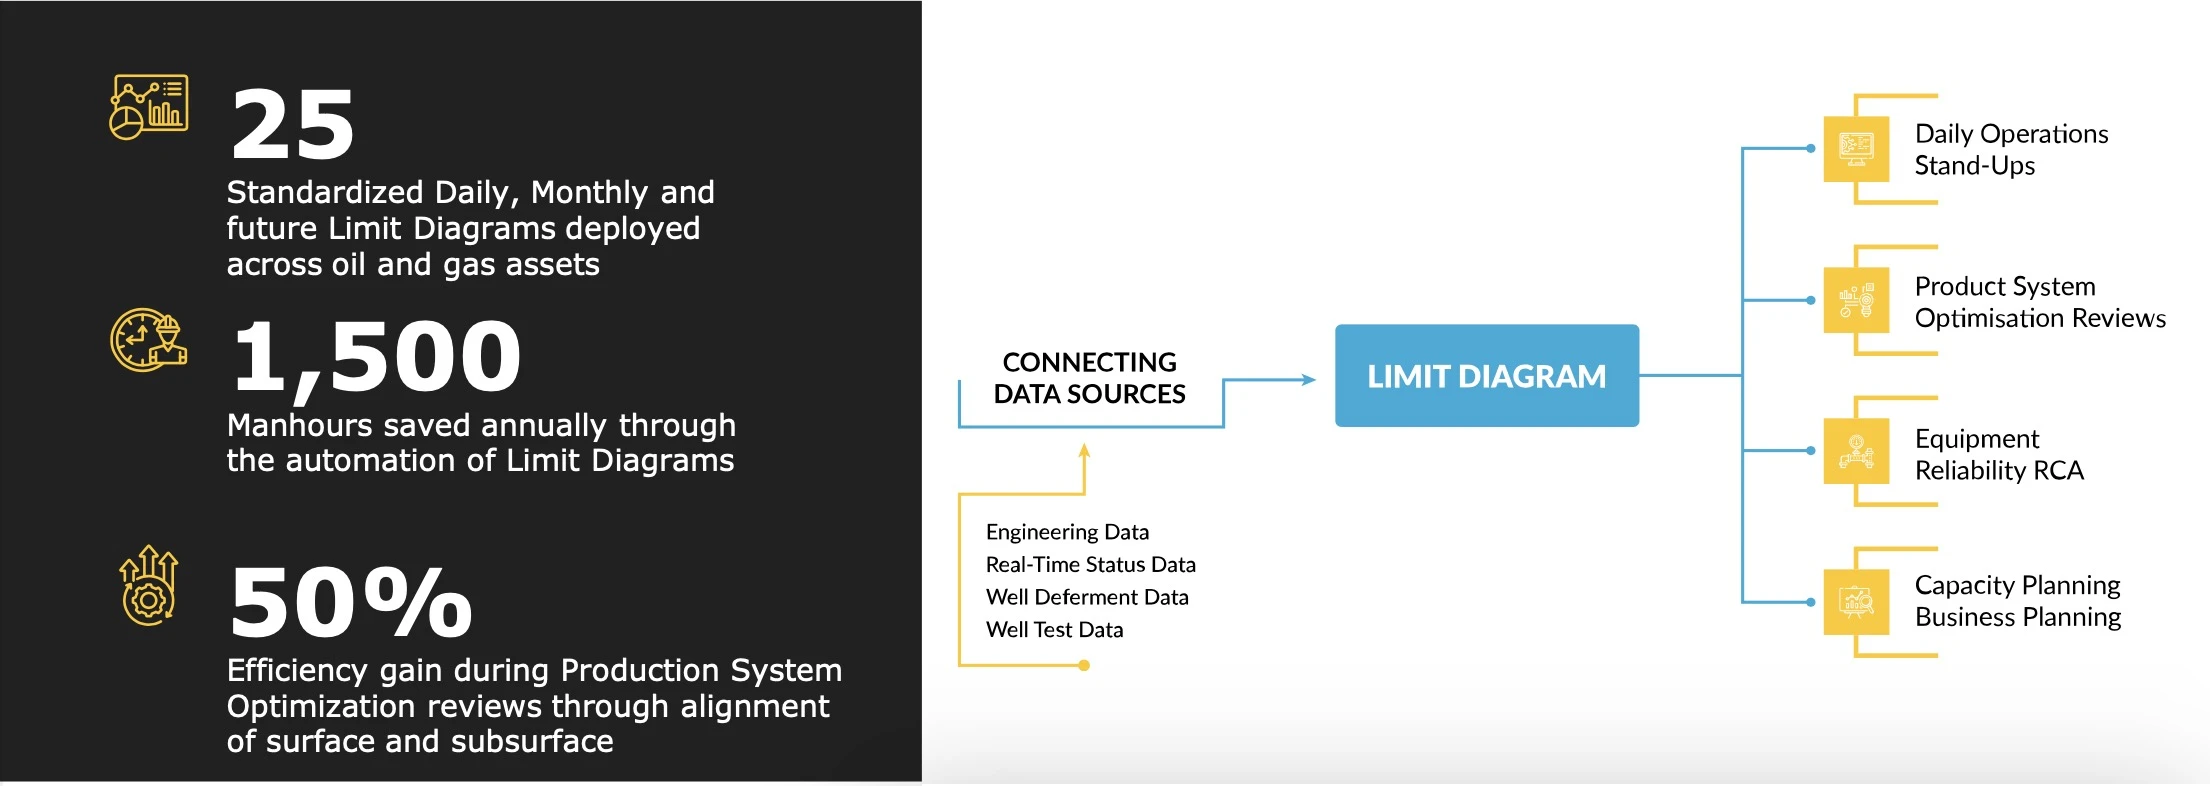
Limits Diagram
Understanding your network constraint to focus your efforts
NIBRAS-NX Limit Diagrams (LD’s) a.k.a. Choke Diagrams, visualize available capacity on different components of your integrated system. The daily LD’s enable operational optimizations towards daily production constraints, while monthly LD’s visualize capacity constraints due to reliability issues, and the future LD’s will highlight constraints due to PVT changes which would require CAPEX for additional capacity.
ADVANCED FEATURES
- Conversion of capacities to Oil, Water and Gas equivalents
- Simulations for different BSW and GOR
- Manual entered reconciliation factor
- Production target and actual production visualized against available capacity
- Equipment capacity calculated from Live Operating Envelopes
- Visualization of unavailable capacity due to deferments and planned maintenance
- Visualization of optimization capacity from optimizers
- Historical visualization of constraints
- Equipment reliability calculations for monthly limit diagrams
SUPPORTED DATA TYPES
- Equipment engineering data
- Real-time status data
- Well deferment data
- Well test data
- Equipment reliability
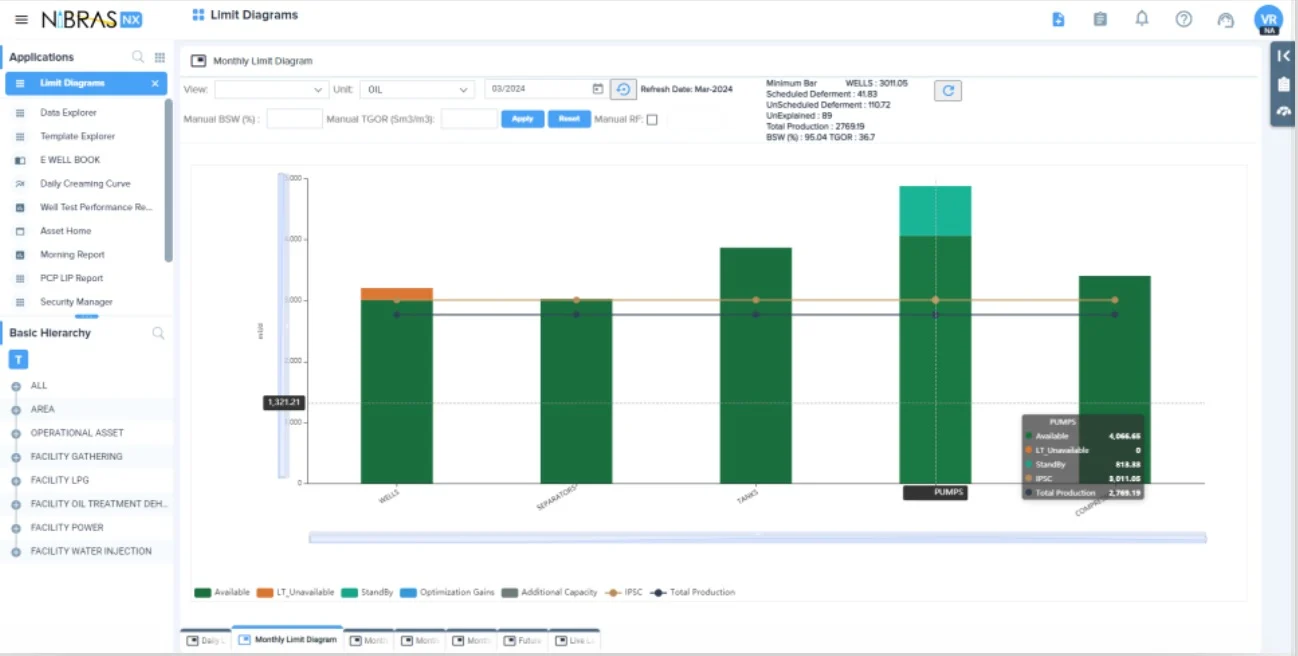

STANDARD DATA VISUALIZATION
- Live Limit Diagrams based on real time status data
- Daily Limit Diagrams for operational optimizations
- Monthly Limit Diagrams for reliability optimizations
- Future Limit Diagrams for capacity increase
- Historical analysis of production targets and available monthly capacity
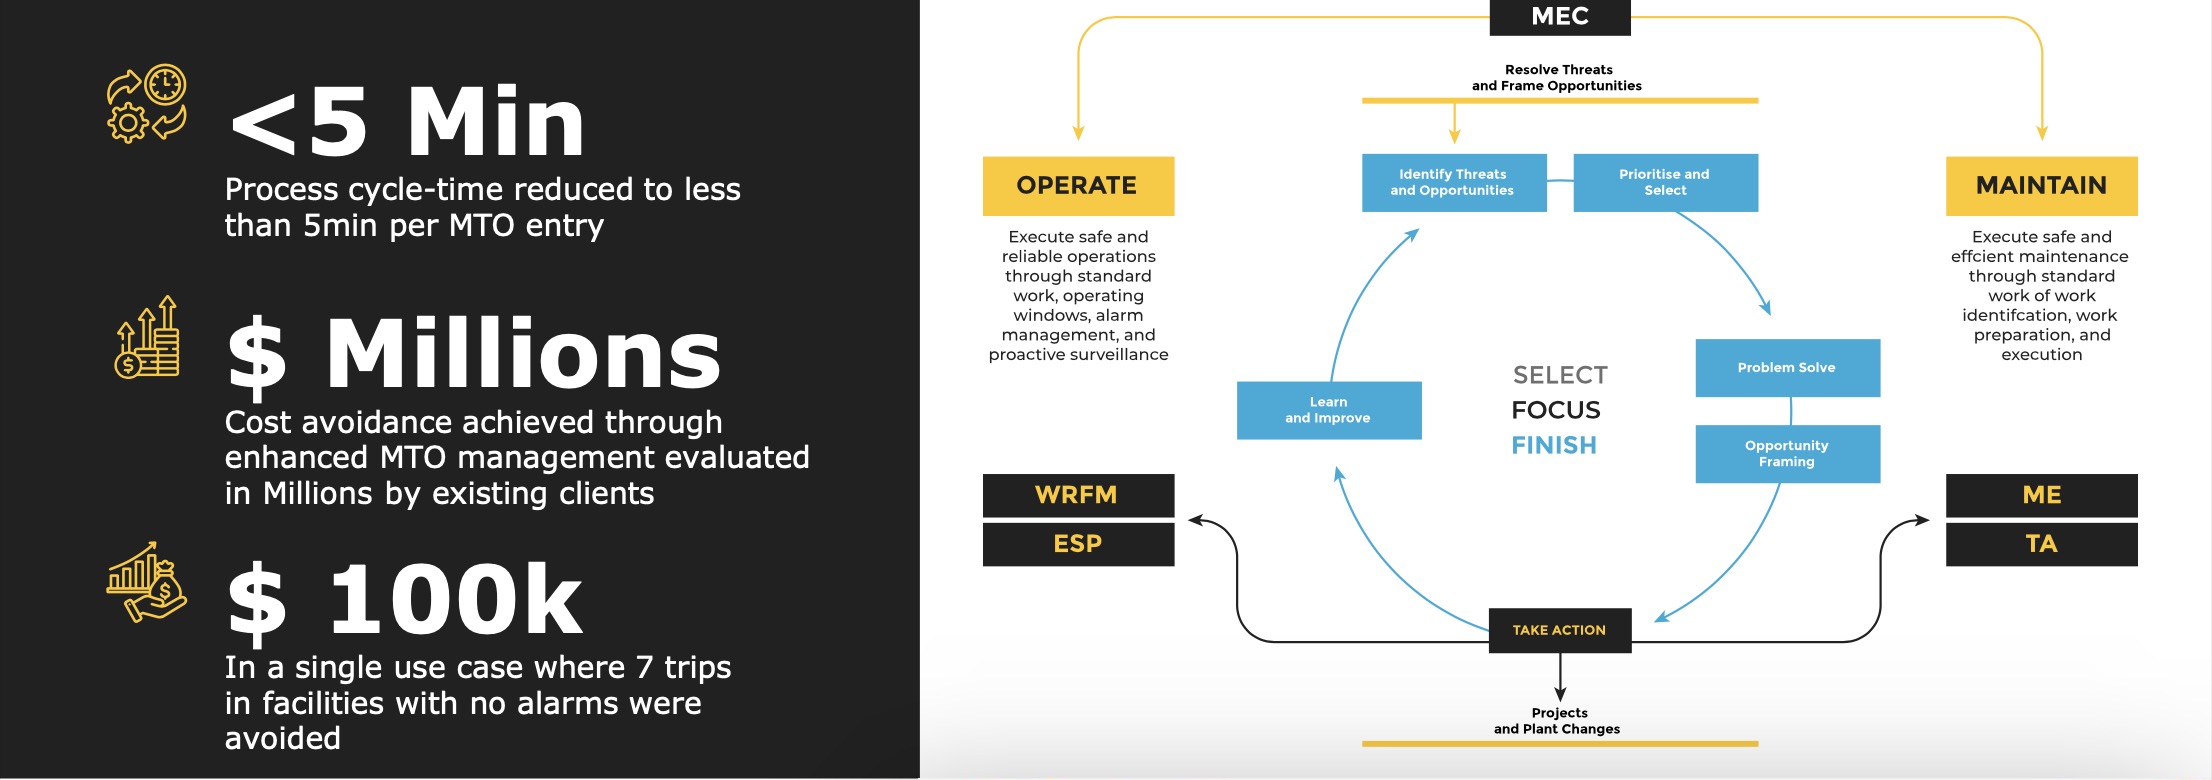
Threats and Opportunities Register
Centralized collection and execution of highest risk threats or value opportunities
NIBRAS-NX Threats and Opportunities Register combines surface and subsurface activities to mitigate threats and realize the highest value opportunities through an end-to-end maturation workflow. Automated prioritization is done as a result of the scoring generated by the workflow’s built-in Risk Assessment Matrix or Benefit Assessment Matrix.
ADVANCED FEATURES
- Standardized process to ensure the execution of threat and opportunity across organization
- Ranking and categorization of entire T/O portfolio management register
- Inbuilt RAM and BAM concepts to prioritize the right request for execution
- Benefit capture standardization and automation
- Human process with decision gates digitized
- Embedded evaluation process (pause and check process)
- Stage wise progress tracking
- Digitization of the problem-solving processes like 5CRQ & CLI
- Advanced MTO module for CAPEX/OPEX intensive entries, and simpler ‘opportunity register’ tools for day-to-day management of low CAPEX/OPEX entries.
- Establishment of a clear line-of-sight on different users/roles responsible for the completion of the different MTO entry’s child activities.
SUPPORTED DATA
- Asset data
- Risk assessment matrix
- Cost analysis
- Build to integrate with other registers

STANDARD DATA VISUALIZATION
- Single repository for all threats and opportunities
- Tactical KPIs on landing page
- Visualization of top 20 T/O across organization hierarchy
- Standard Sankey Chart used to address required details in single widget
- Effective visualization of due dates to monitor the progress
- Widget to monitor recent T/O raised in last 2 weeks
- Widget to monitor T/O related to flaring (saves time for dedicated which works for flaring)
Asset Performance Dashboard
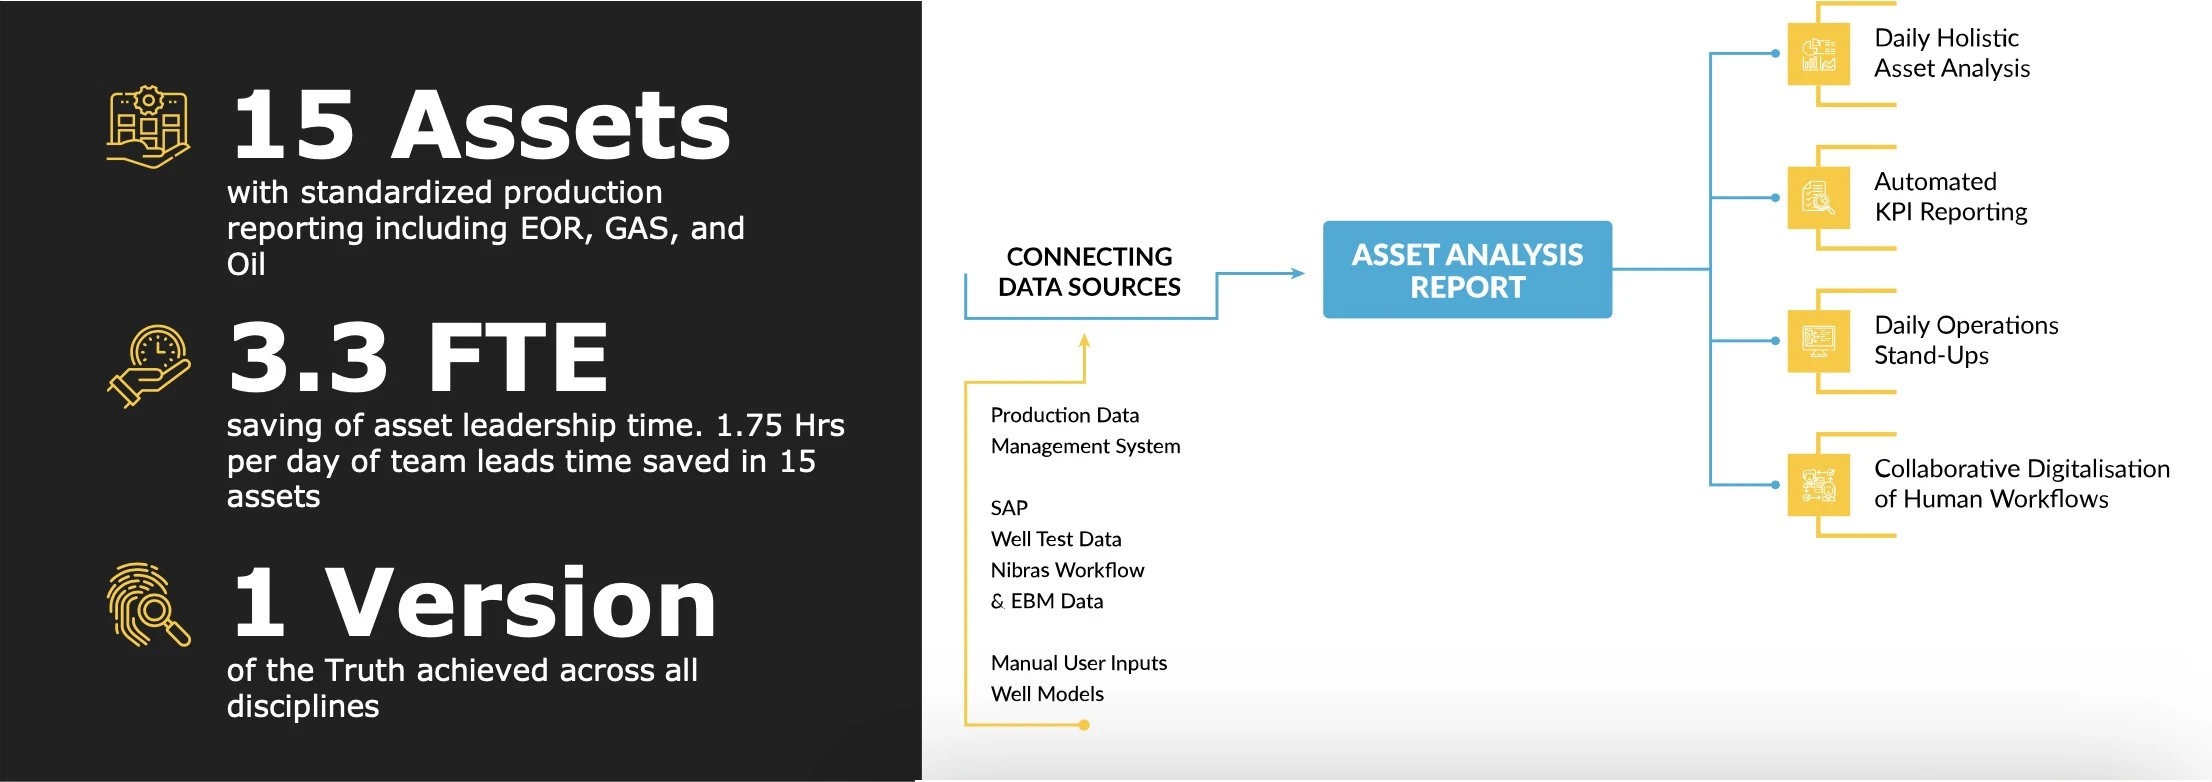
From Strategic Vision to Daily Action: Uniting Data Sources for Comprehensive Asset Management Insights
The Nibras-NX Asset Analysis Report is a highly customizable solution that integrates data from multiple data sources, business processes, and automated KPI’s. The dashboard seamlessly aggregates these information, providing Team Leads and Managers easy access to performance insights for their assets. The report can include production, injection, deferments, compliance with surface or sub-surface operating envelopes, HSE comments, GAS KPI’s, well test compliance KPI’s, huddle dashboard, hoist movements, planned activities, and links to limit diagrams or choke models as examples. Ultimately, these dashboards translate day-to-day operational activities into a comprehensive asset analysis report, showcasing a holistic ‘snapshot’ performance of the assets
ADVANCED FEATURES
- Display total asset performance in a standard way for all assets achieving a Single Version of the Truth
- Lean methodologies enablement to generate an optimum design which takes the various linked business processes into account.
- Eliminates time spent on gathering data, and instead spend time acting on data.
- Enable leaders to start from the identification of a production drop within the asset, all the way down to the root-cause of the production drop, and the ongoing actions being taken by their teams to address such issues
- Further customization with hoist movements, HSSE notifications, change-of- shift notes, planned maintenance activities and more.
- Uses Nibras-NX low code platform to deliver fast, sustainable & scalable deployments
- Enables collaborative digital work environments
SUPPORTED DATA TYPES
- Real-Time Data Historian
- Allocation Database
- Relational data (Oracle or SQL)
- Unstructured data
- Restful API’s
- SharePoint
- Excel Files

TYPICAL VISUALIZATIONS
- Visualization of current actual production (Production Data Management System) overlayed against the targeted integrated production plan, monthly rolling average, year-to-date production target, and deferment targets. Deferment can be color-coded according to deferment code.
- For waterflood reservoirs, injection data can be included.
- Exception based management automated compliance KPI’s for surface and sub-surface which can be sliced-and-diced using the built-in Andon board or business process analysis dashboard
- Links to relevant asset management applications and their KPI’s (deferment analysis, management of threats and opportunities, well test compliance, activities overview, well restoration tool, and limit diagrams as examples)
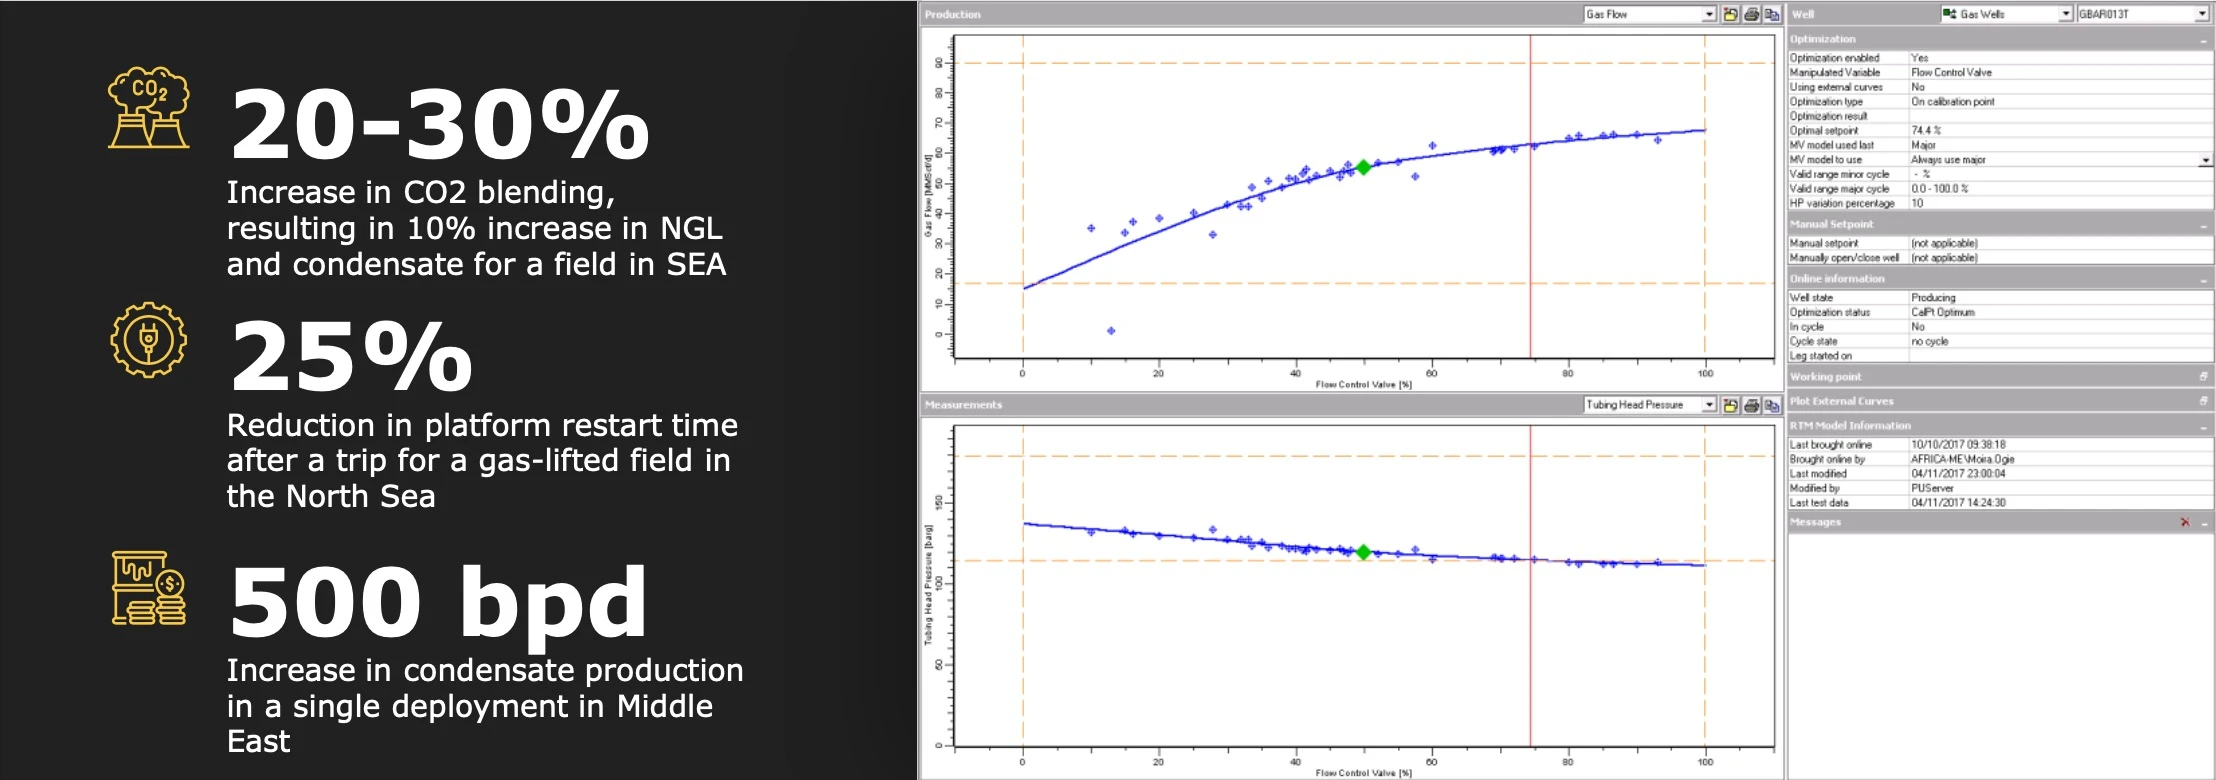
Asset Wide Optimizer
Real-time optimization of well production while taking into account constraints at all levels
NIBRAS-NX Asset-wide Optimizer solution stands on the shoulders of the NIBRAS-NX Virtual Meter, bringing real-time optimization to wells and assets. It’s data-driven model approach blends speed with flexibility in handling constraints at all levels (wells, pipelines, facilities), including compositional requirements (CO2, H2S, etc.)
ADVANCED FEATURES
- Multiple well types can be optimized together
- Constraints can be set at well, header and calibration point level
- Supports back-pressure interaction between wells and pipelines/manifolds
- Optimization objective is user-defined and can take into account cost (e.g. produced water treatment)
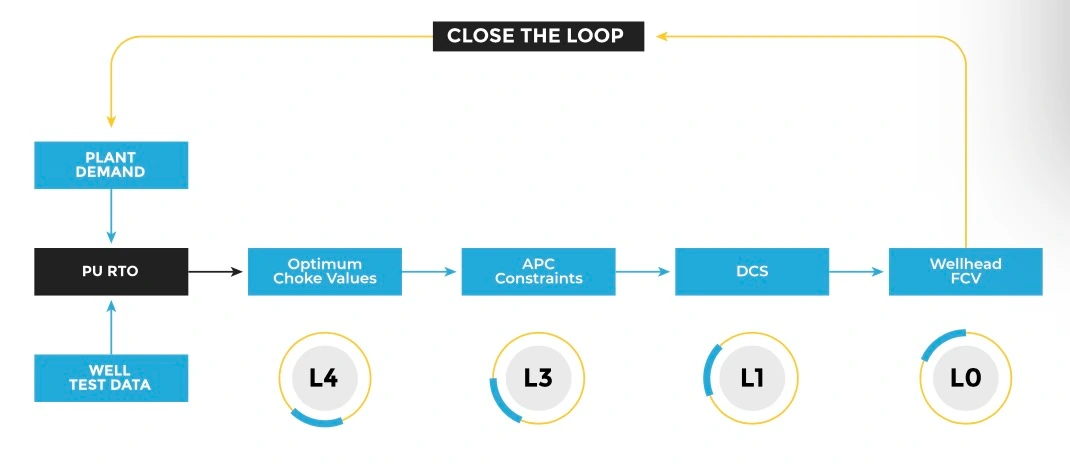
- Optimization can be scheduled at fixed intervals (every 30 mins, hourly, once a day, etc.), triggered ad-hoc (e.g. compressor trip) or manually on-demand
- Setpoints can be sent automatically to the field (closed loop) or used as advisory
- Models are data-driven, using data from normal operational changes and require minimal maintenance
- What-If analysis allows to test different setpoints and compare the results
- Configuration of constraints and optimization criteria can be stored in scenarios and switched to when needed
- Sweep optimization
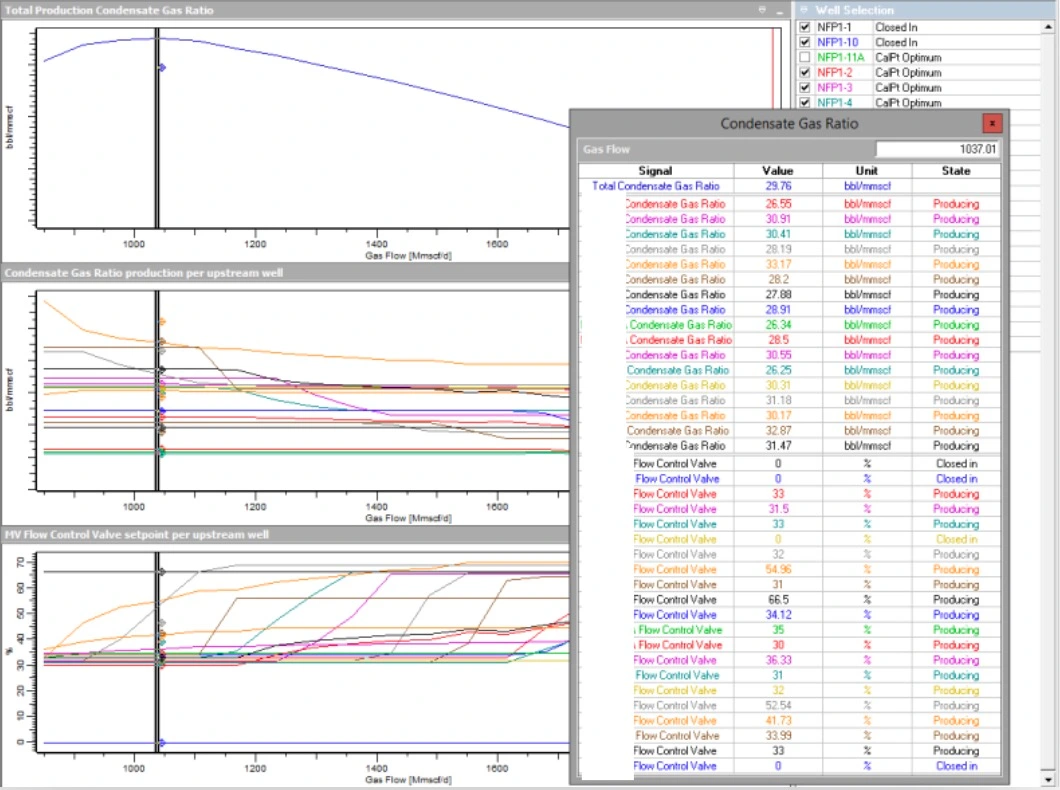
STANDARD WELL DATA VISUALIZATION
- Well optimization screen with constraints and optimizer results
- Calibration point optimization screen with results for all wells and total flow rates
- Sweep optimization over a range of constraints
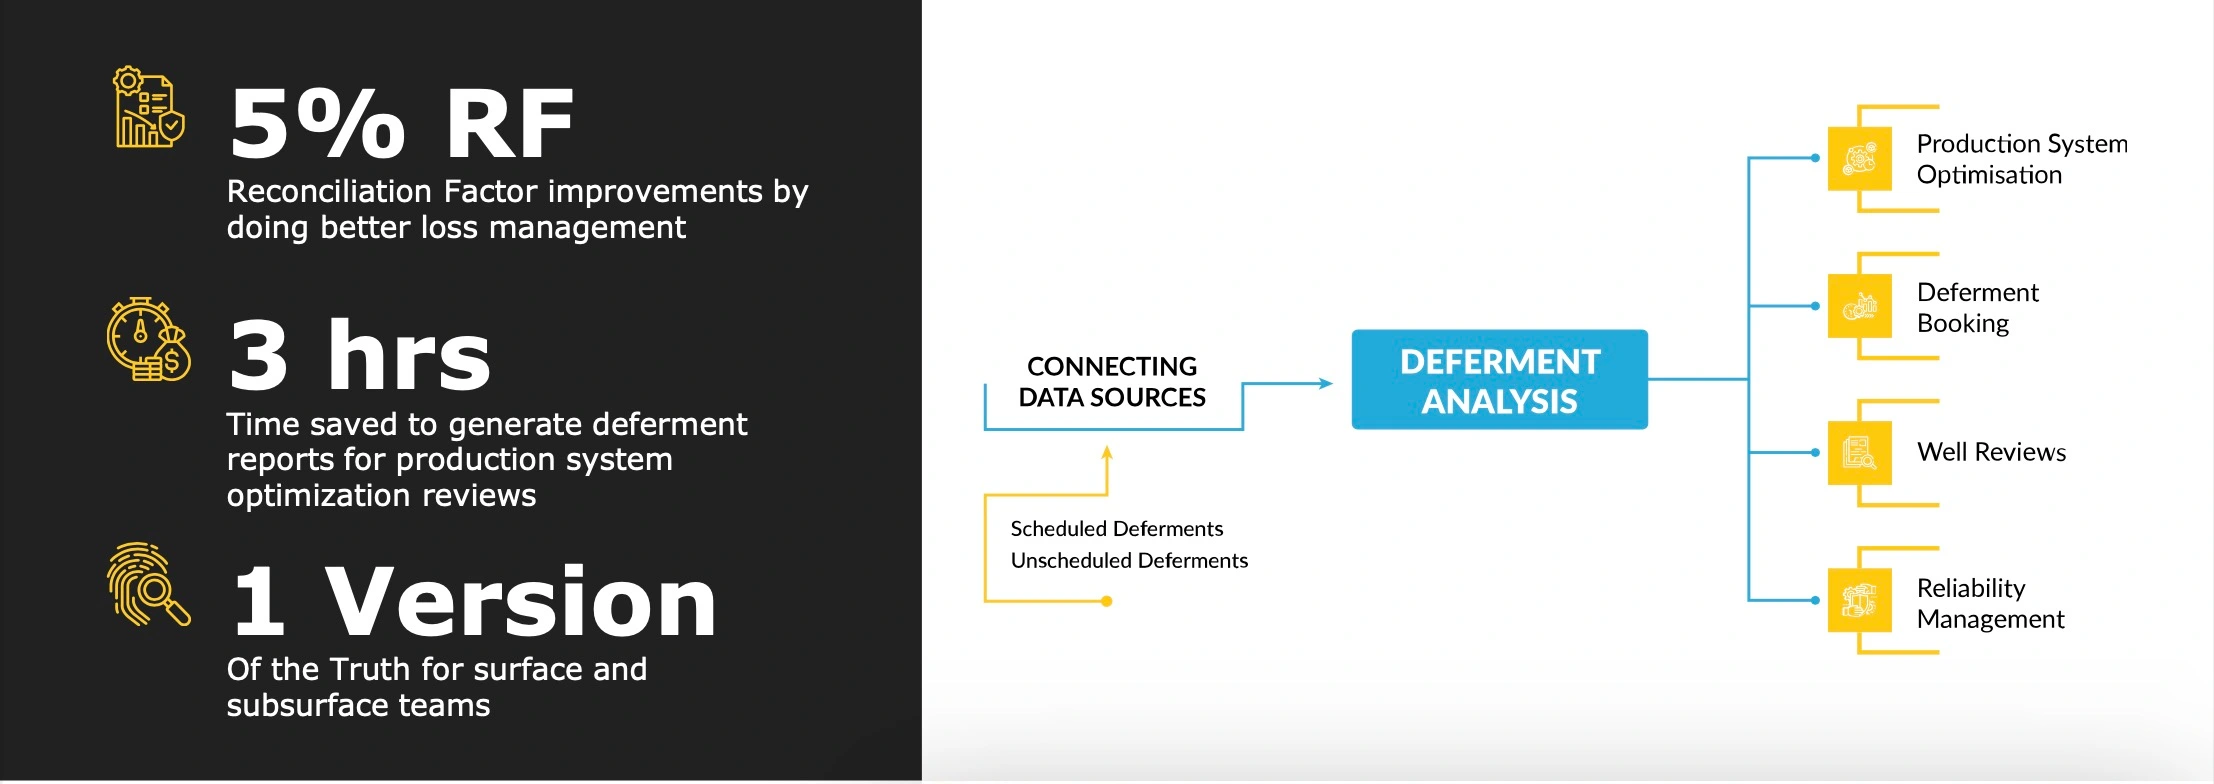
Deferment Analysis
Understanding your losses is the first step towards optimization
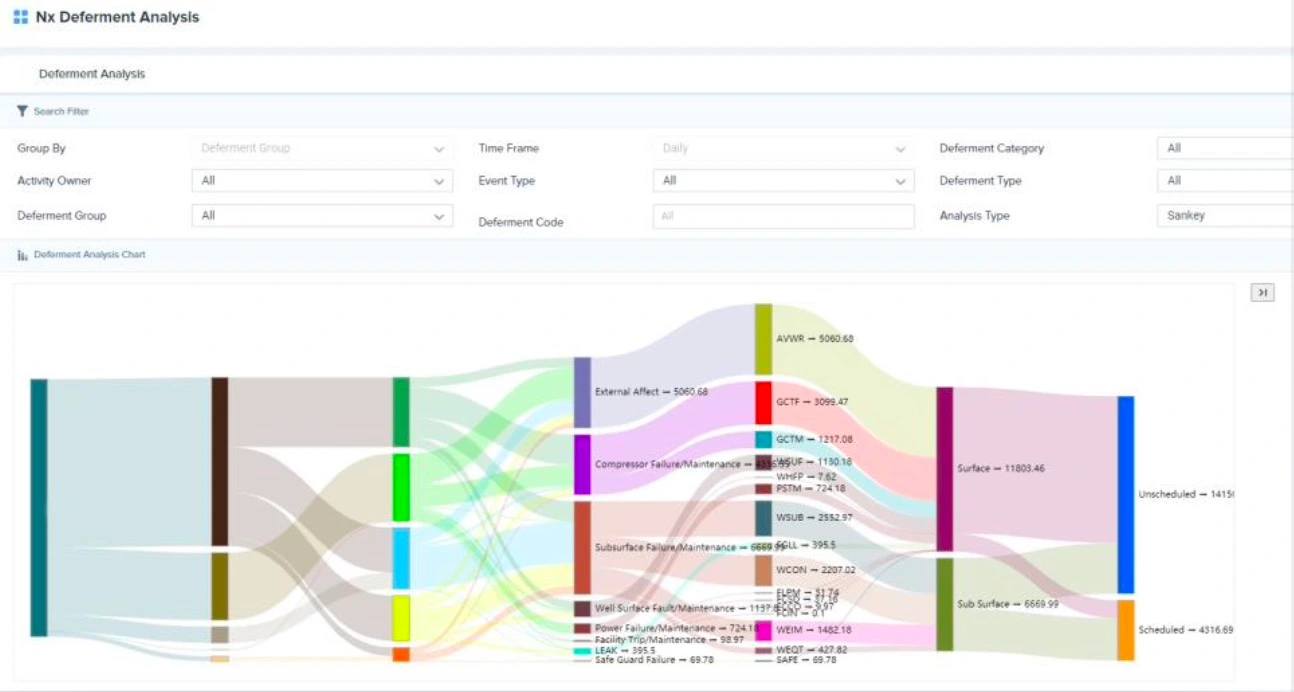
NIBRAS-NX Deferment Analysis is a visualization chart where you can immediately spot the root cause of your biggest production losses. Whether they are in the same asset; have the same root cause; planned or unscheduled maintenance; or surface or sub-surface, this unified visualization will drive alignment in your organization to enhance asset wide optimizations.
ADVANCED FEATURES
- Sanky Chart Visualization with groupings by:
1. Surface / subsurface
2. Scheduled / Unscheduled
3. Assets
4. Production Stations
5. Deferment Codes
Note that groupings are customizable based on the available data that is recorded in your loss management system
- Pareto Analysis to show the cause of the highest losses
- Historical analysis to visualize improvements throughout the history
- Advanced filtering capabilities to support detailed analysis and understand the root cause of the issue
- Roll up functionality to sum the total losses
- Connected to hierarchical browsing to assess losses on different levels of your organization
DATA VISUALIZATION
- Sanky Charts
- Pareto Analysis
- Historical Analysis
- Tabular loss records with filtration capabilities
iNNOVATEQ COMMITS TO A SUCCESSFULL DEPLOYMENT OF YOUR DX ROADMAP
SUPPORTED INTERFACES
- Energy Components deferments table
- Any standard SQL / Oracle table with standardized groupings can be attached to the report
- Proprietary loss management system exposing an API can have customized adaptors to retrieve the data