Single Opportunity Register
Project Description
Many attempts were made to understand all opportunities within the company however managed very decentralized and with different categorizations.
The limit diagram indicates the constraint worked on and the opportunity register will have the opportunities available to operate as close as possible to the constraint.
Achieved Business Benefits
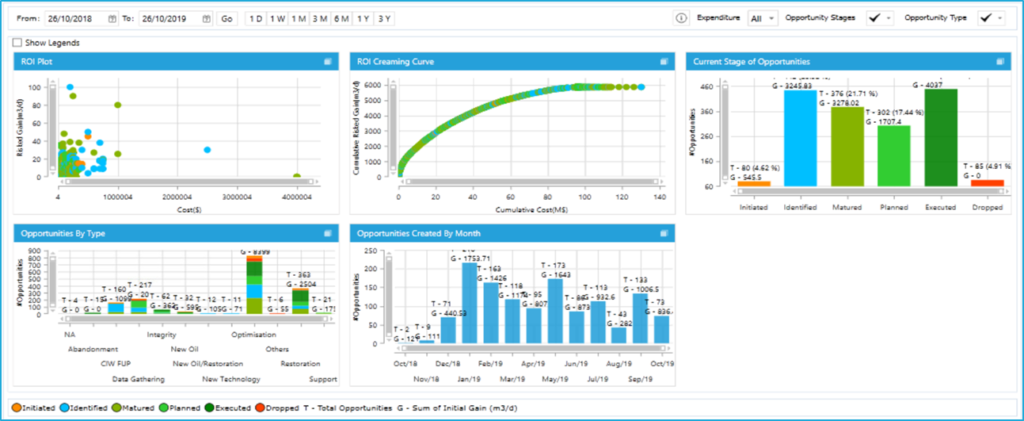
Visual management of the opportunity maturation process
Return on investment creaming curve for budgeting during business planning
Standard categorization of opportunities across surface and sub surface for better visualization.
Tags
The Tool


