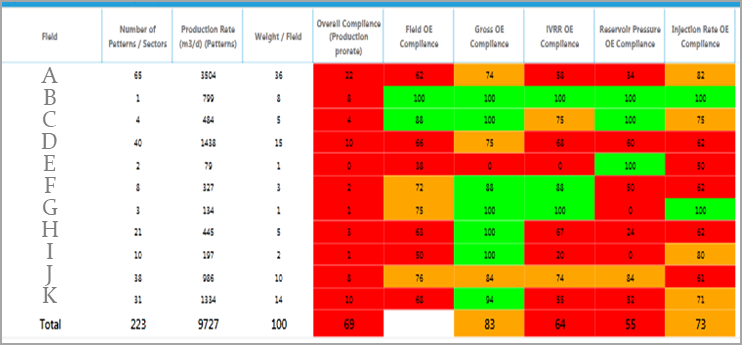
Reservoir Compliance Summary shows WF (Water-Flood) reservoir compliance for all fields in a given asset. The portfolio view allows leadership to focus efforts on fields with highest value opportunities/gaps.
Reservoir Visual Control at field level show WF-Patterns’ Compliance highlighting opportunities at portfolio level
Reservoir Visual Control at Pattern level show non-compliant patterns and highlight highest-value opportunities
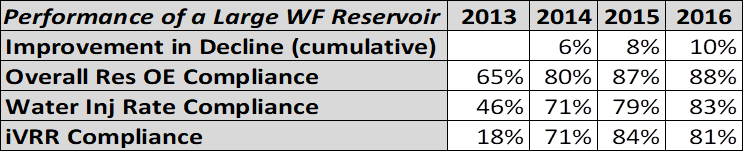
Lean WF Reservoir Management helped multiple asset teams focus their efforts on improving compliance to Res_OE. Performance of one of PDO’s largest WFs is in the table above.
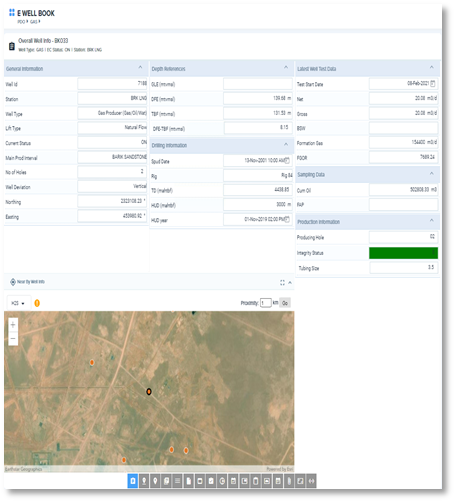
Reservoir Surveillance by Exception
Smart Reservoir Management supported by Exception Based Surveillance of the Reservoirs enforcing roles and responsibilities.
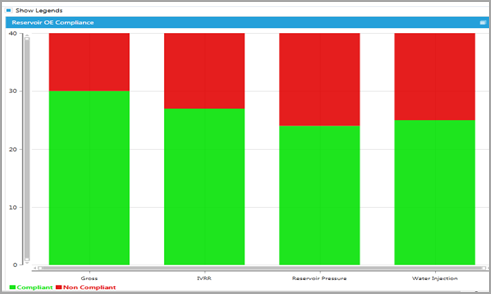
Visual Management
Captures the Performance of a Reservoir by highlighting the compliance of the Patterns.
Visualization of the operating band and current state of the KPI’s of each Pattern in a Reservoir.
Hidden Deferment
Determines the amount of reduced oil (hidden deferment) as a result of sub-optimal fluid injection into the Reservoir (Polymer, Gas, Water and Steam).
Interference Analysis
Helps in visualization of Reservoir communication by trending the Injection and Production data available via corporate databases (EC, Real time Data, LIMS)
Pattern and Pair Configuration
Enables end user to configure Patterns and Pairs using Sub-Surface allocation for members (wells) based on their subject matter expertise to support better Reservoir Management.
Compliance Report
Highlights the Performance of a Cluster based on KPI’s and Oil Produced (Weighted Compliance). Quick support in decision making by highlighting the Reservoirs which demands attention for better Reservoir Management.
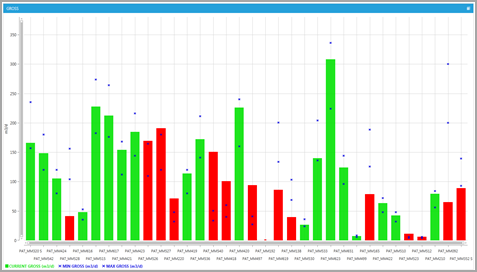
Diagnostic Plots – Trending and Reporting
Graphical support to analyze the following data trends to boost decision making: